Home
>
Trading Discussion
>
Topic
Sawtooth Volatility
Posted by baffled1
|
Sawtooth Volatility January 18, 2016 05:18PM |
Registered: 8 years ago Posts: 161 |
Hope this is useful to someone. Average traders look at canned volatility algos which rely on standard deviation from a mean; superior traders look at historical return volatility. Neither is perfect, and what I'm sharing here isn't perfect either, but it does capture an important feature missed by the others: sawtoothing. By sawtoothing I mean that heartstopping zigzagging we all love and hate. Standard deviation misses that because by definition it's looking for a mean during sawtoothing; historical return volatility misses it because of the timeframes used to calculate average returns. So, the method below is aimed directly at capturing sawtooth frequency. It literally counts the sawtooths of a size you specify. Sawtooth size is set up as a percentage value so this works for all timeframes- reset percentage in screen edit as needed.
~EDIT - e.g., in forex, much smaller "sawheight" must be used.
I don't pretend to know the optimal settings for your security, so there are inputs for you. The code is:
Here's a snapshot, using the default Sawtooth settings:
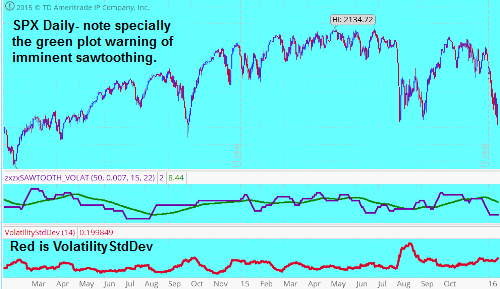
Gamblers roll the dice; Traders load the dice.
Edited 2 time(s). Last edit at 01/21/2016 07:11AM by baffled1.
~EDIT - e.g., in forex, much smaller "sawheight" must be used.
I don't pretend to know the optimal settings for your security, so there are inputs for you. The code is:
#OpenSource, no copyright claimed. Dev by KingMakerForex.
declare lower;
#Next line defines how big a sawtooth you want to find.
input sawheight = 0.007;
#Next line defines how far back you want to look for your sawtooths.
input addthemup = 50;
#Next four lines define how tight in time you want your sawtooths.
input nearlength = 15;
input farlength = 22;
def v1 = absvalue((close-close[nearlength])/close[nearlength])>=sawheight;
def v2 = absvalue((close[farlength]-close[nearlength])/close[nearlength])>=sawheight;
#Next line specifies that only a V or inverted V are a sawtooth, ie, both v1 and v2
#must be TRUE, so lone uptrends or lone downtrends don't count.
def v3 = v1 and v2;
#Next line says add up your sawtooth events over the specified period.
def countv3 = sum(v3,addthemup);
#Now you plot it without averaging.
plot mycount = countv3;
#Here's your default average.
input sawtoothavg = 50;
#Now you plot the average.
plot mycountavg = average(countv3,sawtoothavg);
~EDIT- realized I should've included absvalue a couple places.
Here's a snapshot, using the default Sawtooth settings:
Gamblers roll the dice; Traders load the dice.
Edited 2 time(s). Last edit at 01/21/2016 07:11AM by baffled1.
|
Re: Sawtooth Volatility January 23, 2016 02:49PM |
Registered: 8 years ago Posts: 161 |
Folks, my sincere apologies.  After looking over the previous SAWTOOTH code I realized that it's not expressing what I intended, though it does seem to indicate trend change. So I spent the last four days and nights fixing it.
What I meant to do was measure total sawtoothing of a given amplitude across a given period of time, and an average of those events across a given period of time. Not as easy as it sounds. VERY IMPORTANT- IF YOU RESET “Mvmiddle” it must always be an EVEN NUMBER (I need to add rounding code to avoid that issue and may do it when I have more confidence). In my opinion it's now a much more useful code. The end of lengthy flat periods (in one plot) and the joining and separation of the two plots signal sharp moves and trend changes.
Gamblers roll the dice; Traders load the dice.
Edited 1 time(s). Last edit at 01/23/2016 02:53PM by baffled1.
After looking over the previous SAWTOOTH code I realized that it's not expressing what I intended, though it does seem to indicate trend change. So I spent the last four days and nights fixing it.
What I meant to do was measure total sawtoothing of a given amplitude across a given period of time, and an average of those events across a given period of time. Not as easy as it sounds. VERY IMPORTANT- IF YOU RESET “Mvmiddle” it must always be an EVEN NUMBER (I need to add rounding code to avoid that issue and may do it when I have more confidence). In my opinion it's now a much more useful code. The end of lengthy flat periods (in one plot) and the joining and separation of the two plots signal sharp moves and trend changes.
#SAWTOOTH VOLAT
#OpenSource, no copyright claimed. Dev by KingMakerForex.
declare lower;
#Reset “minmountain” to a sensitivity that works for your security. This value defines the height/depth
#of sawtooths you're looking for in terms of minimum percent difference between top (or bottom) and
#right/left points.
input minmountain = 0.99;
#The “Msum” is the range across which you're looking for sawtooths.
input Msum = 50;
#Mvmiddle must always be an even number. This value marks the width of your sawtooth.
input Mvmiddle = 14;
def mountaintop = highest(high,Mvmiddle);
def mountainR = lowest(low,Mvmiddle/2)<mountaintop*minmountain;
def mountainL = lowest(low[(Mvmiddle/2)+1],Mvmiddle/2)<mountaintop*minmountain;
def mountain = mountainR AND mountainL;
plot Above = mountain;
def mountainSUM = sum(Above,Msum);
Above.setlineweight(3);
Above.SetDefaultColor(Color.blue);
Above.SetPaintingStrategy(PaintingStrategy.BOOLEAN_ARROW_UP);
#NOW ADDING VALLEY CODE
def minvalley = 2-minmountain;
def valleybot = lowest(low,Mvmiddle);
def valleyR = highest(high,Mvmiddle/2)>valleybot*minvalley;
def valleyL = highest(high[(Mvmiddle/2)+1],Mvmiddle/2)>valleybot*minvalley;
def valley = valleyR AND valleyL;
plot Below = valley;
def valleySUM = sum(Below,Msum);
Below.setlineweight(3);
Below.SetDefaultColor(Color.plum);
Below.SetPaintingStrategy(PaintingStrategy.BOOLEAN_ARROW_DOWN);
plot MVsum = mountainSUM+valleySUM;
#The “sumavg” is the moving average length.
input sumavg = 20;
plot MVsumavg = average(MVsum,sumavg);
Gamblers roll the dice; Traders load the dice.
Edited 1 time(s). Last edit at 01/23/2016 02:53PM by baffled1.
Sorry, only registered users may post in this forum.
Trade with Knowledge, Trade with Power - ResearchTrade.com.