Home
>
Trading Discussion
>
Topic
Synthetic Trendlines and FLIR
Posted by baffled1
|
Synthetic Trendlines and FLIR January 13, 2016 12:45AM |
Registered: 8 years ago Posts: 161 |
Synthetic Trendlines
If your head has a tendency to turn red and explode, you might want to skip this thread... Comments welcome.

If you're wondering what this has to do with Thinkscript, please stay tuned- I'm planning to try to code some of it and maybe others will too.
Thought I'd start a little thread here for anybody interested in Synthetic Trendlines. First, a little background. Synthetics (STs) are not to be confused with FLIR (forward-looking information radar), though both were discovered by the same trader (Dennis Hudson) and published in Futures Magazine (FLIR Nov 2009; ST Mar 2012), which is now called Modern Trader. But FLIR is what led to ST. So I might as well start there because there's a mathematical relationship between the two. As I continue to post, I'll probably put up some example forecasts from each. Takes time, though, because I'm still learning how to use Thinkscript Atan and plot it, so I have to do the forecasts manually. If you can write the code for any FLIR or ST functions, it's welcome here.
FLIR is the simplest to understand. Be warned- there is “ordinary” FLIR which forecasts what you expect, and there's a fairly rare “momo change FLIR”, which is a deadly Black Swan. Stoplosses are a good thing.
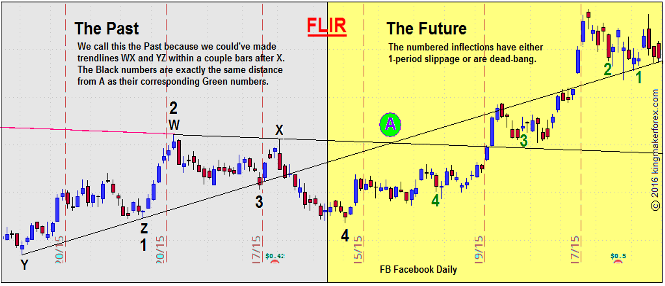
To use FLIR, you first draw a pair of intersecting trendlines, one using the highs, and one using the lows. Precision counts. Let's call the intersect “A”. To the left of A, pick any major inflection (top or bottom) and then count how many bars it is from A. Then, if you count to the right the same number of bars from A, you will notice that you reach another inflection (with 1 bar slippage sometimes). Reversal sizes will vary.
Here's a FLIR chart (I didn't find any deadly momo-change FLIRs in this one):
BUT, there's more to FLIR. So far, I've offered a simple way to use it, i.e., by counting bars to right and left of A, a mechanical process which incorporates time. But the underlying logic had nothing to do with time. The time element is just a sort of byproduct of Hudson trying to handle time and price separately, i.e., to extinguish time from the first calculus altogether (by connecting prices), and only bringing time back into the equation later. The theory was that the general terms of the uncertainty principle could be applied to financial markets, i.e., you cannot know two things simultaneously, such as position and momentum, direction and magnitude, or time and price. Come to think of it, that's why most of us use at least two indicators- one for price boundaries, and one for timing. The way FLIR really started (I have the original ebook on it, no longer available) was not by measuring distance (time) from A; rather, at any point of inflection to the left of A, it began by measuring the vertical distance between trendlines, and then finding where that identical distance between trendlines occurred to the right of A. So, only in my first explanation for using FLIR do we have time as a factor.
Why it works. Best theory so far would seem to be that when the slope of one trendline intersects the other, it creates an integral of market optimism and market pessimism, a reference point, so that movement to left or right of A the same distance shows similar turning points or “inflections” in sentiment. It may also say something about the sum (sigma) of all values to right and left, and I plan to test that theory soon. What's your best theory?
Besides finding inflections, another major consequence of this (temporary) dustbinning of time is that it enables us to get a view of the magnitude of a future move. I don't show it on the chart, but if you create FLIR on any chart, then randomly pick any bar to right or left of A, you'll typically find that the distance from the high or low of that bar to one of the trendlines is nearly the same as the distance of its opposite number from one of the trendlines. And coding THAT into Thinkscript could be a real challenge.
There is yet more to FLIR. And now we can re-introduce time. Notice that the number of bars in the trend after an inflection to the left of the A horizon is almost always the same as the number of bars in the trend after the corresponding inflection to the right of the A horizon. There may be other FLIR observations to be made, such as the price-value relationships between corresponding trends- yet another massive TS challenge. But enough on FLIR for now. Just wanted to give some background to STs, which I'll take up in my next post.
Edited 2 time(s). Last edit at 01/13/2016 01:06AM by baffled1.
If your head has a tendency to turn red and explode, you might want to skip this thread... Comments welcome.
If you're wondering what this has to do with Thinkscript, please stay tuned- I'm planning to try to code some of it and maybe others will too.
Thought I'd start a little thread here for anybody interested in Synthetic Trendlines. First, a little background. Synthetics (STs) are not to be confused with FLIR (forward-looking information radar), though both were discovered by the same trader (Dennis Hudson) and published in Futures Magazine (FLIR Nov 2009; ST Mar 2012), which is now called Modern Trader. But FLIR is what led to ST. So I might as well start there because there's a mathematical relationship between the two. As I continue to post, I'll probably put up some example forecasts from each. Takes time, though, because I'm still learning how to use Thinkscript Atan and plot it, so I have to do the forecasts manually. If you can write the code for any FLIR or ST functions, it's welcome here.
FLIR is the simplest to understand. Be warned- there is “ordinary” FLIR which forecasts what you expect, and there's a fairly rare “momo change FLIR”, which is a deadly Black Swan. Stoplosses are a good thing.
To use FLIR, you first draw a pair of intersecting trendlines, one using the highs, and one using the lows. Precision counts. Let's call the intersect “A”. To the left of A, pick any major inflection (top or bottom) and then count how many bars it is from A. Then, if you count to the right the same number of bars from A, you will notice that you reach another inflection (with 1 bar slippage sometimes). Reversal sizes will vary.
Here's a FLIR chart (I didn't find any deadly momo-change FLIRs in this one):
BUT, there's more to FLIR. So far, I've offered a simple way to use it, i.e., by counting bars to right and left of A, a mechanical process which incorporates time. But the underlying logic had nothing to do with time. The time element is just a sort of byproduct of Hudson trying to handle time and price separately, i.e., to extinguish time from the first calculus altogether (by connecting prices), and only bringing time back into the equation later. The theory was that the general terms of the uncertainty principle could be applied to financial markets, i.e., you cannot know two things simultaneously, such as position and momentum, direction and magnitude, or time and price. Come to think of it, that's why most of us use at least two indicators- one for price boundaries, and one for timing. The way FLIR really started (I have the original ebook on it, no longer available) was not by measuring distance (time) from A; rather, at any point of inflection to the left of A, it began by measuring the vertical distance between trendlines, and then finding where that identical distance between trendlines occurred to the right of A. So, only in my first explanation for using FLIR do we have time as a factor.
Why it works. Best theory so far would seem to be that when the slope of one trendline intersects the other, it creates an integral of market optimism and market pessimism, a reference point, so that movement to left or right of A the same distance shows similar turning points or “inflections” in sentiment. It may also say something about the sum (sigma) of all values to right and left, and I plan to test that theory soon. What's your best theory?
Besides finding inflections, another major consequence of this (temporary) dustbinning of time is that it enables us to get a view of the magnitude of a future move. I don't show it on the chart, but if you create FLIR on any chart, then randomly pick any bar to right or left of A, you'll typically find that the distance from the high or low of that bar to one of the trendlines is nearly the same as the distance of its opposite number from one of the trendlines. And coding THAT into Thinkscript could be a real challenge.
There is yet more to FLIR. And now we can re-introduce time. Notice that the number of bars in the trend after an inflection to the left of the A horizon is almost always the same as the number of bars in the trend after the corresponding inflection to the right of the A horizon. There may be other FLIR observations to be made, such as the price-value relationships between corresponding trends- yet another massive TS challenge. But enough on FLIR for now. Just wanted to give some background to STs, which I'll take up in my next post.
Edited 2 time(s). Last edit at 01/13/2016 01:06AM by baffled1.
|
Re: Synthetic Trendlines and FLIR January 14, 2016 02:53PM |
Registered: 8 years ago Posts: 161 |
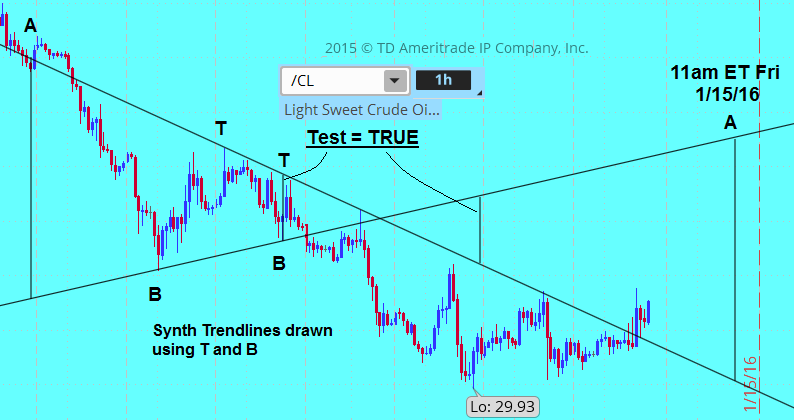
On second thought, while I write up the ST post, I promised a couple forecasts for FLIR and ST. So here's a couple FLIR forecasts. The size of the reversal may vary, and there's 1-period slippage that's probably due more to my drawing imprecision than to the algo itself, so coding this into TS would be most helpful.. STOPLOSSES are a good thing because what FLIR is "really" measuring in its underlyig math is change of momentum, and that can once in awhile translate into a continuation rather than a reversal from previous mini-trend. These Black Swans aren't all bad because when they occur they're usually pretty big moves. So if you see that developing, you could trade it.
I am NOT encouraging anybody to trade these signals. For now, just watch and see.
FLIR /CL Hourly says inflection 11am ET Fri 1/15/16...
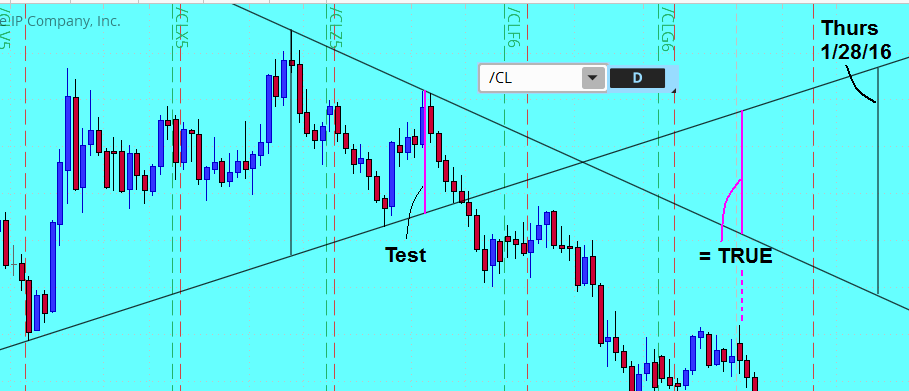
FLIR /CL Daily says inflection Thurs 1/28/16...
EDIT~~ oh, and 1/21/16 (not marked above) can also be extracted from this FLIR.
Edited 2 time(s). Last edit at 01/14/2016 04:11PM by baffled1.
I am NOT encouraging anybody to trade these signals. For now, just watch and see.
FLIR /CL Hourly says inflection 11am ET Fri 1/15/16...
FLIR /CL Daily says inflection Thurs 1/28/16...
EDIT~~ oh, and 1/21/16 (not marked above) can also be extracted from this FLIR.
Edited 2 time(s). Last edit at 01/14/2016 04:11PM by baffled1.
|
Re: Synthetic Trendlines and FLIR January 15, 2016 02:20PM |
Registered: 8 years ago Posts: 161 |
FLIR Hourly /CL forecast confirmed, with 1-hr slippage (as mentioned above). Forecasted inflection at 11am ET, actual was 12n ET. I think would be more precise with TS coding instead of manual drawing. I'm having fits with the code. Can anybody help? Simply need to be able to fix in place the two trendlines. I understand would have to be reset for each security and timeframe but it would be a beginning. Code I have so far is dynamic so lines change daily or hourly etc. But with a fixed pair, it becomes easy to place verticals to the right of the intersect that correspond to inflections to the left of the intersect.
Gamblers roll the dice; Traders load the dice.
Edited 1 time(s). Last edit at 01/15/2016 02:20PM by baffled1.
Gamblers roll the dice; Traders load the dice.
Edited 1 time(s). Last edit at 01/15/2016 02:20PM by baffled1.
|
Re: Synthetic Trendlines and FLIR January 15, 2016 05:01PM |
Registered: 10 years ago Posts: 21 |
|
Re: Synthetic Trendlines and FLIR January 15, 2016 05:42PM |
Registered: 8 years ago Posts: 161 |
robertc777, I was starting to think nobody was listening. Nope, no reading material- pretty much summarized FLIR already from the article and the old ebook. Coding for Synthetics is even harder. So I want to wrap up FLIR first. Thanks for tuning in- feel free to share some FLIR forecasts if you make them.Quote
robertc777
-------------------------------------------------------
> Baffled1,
> You got me hooked. I am trying to find out more
> on this subject. Keep it up, hopefully I can
> contribute. Love this kind of stuff. Any reading
> material you suggest?
Gamblers roll the dice; Traders load the dice.
|
Re: Synthetic Trendlines and FLIR January 16, 2016 11:17AM |
Registered: 8 years ago Posts: 161 |
I ran FLIR for /CL. Maybe a few forecasts and folks see how good it is then we can get some coding ideas. I was very precise in manually creating trendlines on TOS, with exact prices. Please check my work:
Tops used: 9am ET, 1/12/16 TO 9am ET 1/13/16
Lows used: 2pm ET 1/12/16 TO 10am ET 1/13/16
The following are the inflection hours (I still say 1-period slippage possible). There's a holiday intervening and I'm not sure how that affects anything, if at all. FLIR works on any chart timeframe, but these are for Hourly chart. The list shows when inflections are expected as the number of TRADING hours after yesterday's (Friday's) Close. Values in parentheses are a speculation on how many bars will be in the resulting move, based on how many were in the corresponding inflection to the left of the intersect. Please check my work!.
This is not a recommendation to trade- just watch.
3(3), 6(3), 7(1), 21(10*), 36(1), 42(6), 48(2), 52(4*), 54(2), 59(1), 70(2).
* Small intervening opposed bars likely, but overall trend consistent.
Gamblers roll the dice; Traders load the dice.
|
Re: Synthetic Trendlines and FLIR January 17, 2016 06:24AM |
Registered: 8 years ago Posts: 161 |
Welcome back to the asylum.
Synth Trendlines
Having declared war on time, the next thing Hudson challenged was the haphazard way that trendlines get drawn. Everybody's got a method- I'm not picking on anybody's method, as long as it works for you. What he thought was that there should be a standard model. But the sticky part (again) was getting rid of either time or price.
We all know how to draw trendlines. But these methods introduce the hazard of creating infinite colinear functions because it incorporates time at an infinity of points. And the same could be said of price, though arguably as a “smaller infinity” of colinearities because the likely price range is smaller than the time range.
So he makes this intuitive leap: that there's a causal and intimate relationship between three points in two mutually exclusive cases.
The first general case was the differences in price between a High and any two Lows either side of it and below it (or the differences between a Low and any two Highs either side of it and above it). This approach extinguished time from the calculation along with any colinearity risk.
The second general case was the differences in time between a High and any two Lows either side of it and below it (or the differences in time between a Low and any two Highs either side of it and above it). This approach extinguished price from the calculation along with any colinearity risk.
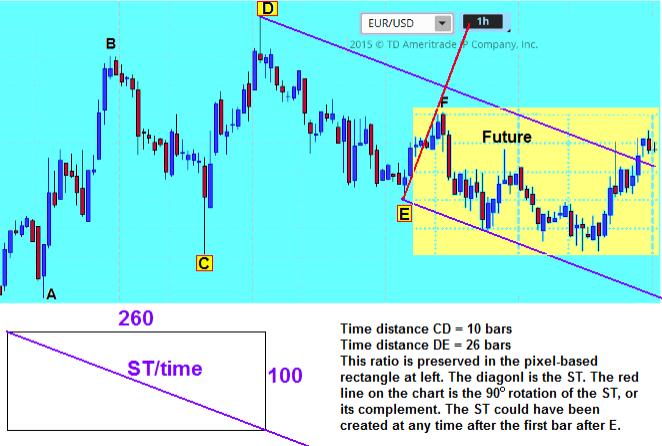
Let's take up the second general case first, that of time. In the image below, note that price is nowhere present in the calculation, except as giving us inflection Anchors CDE. You can draw your own conclusions about the value of this method from the picture. Enough for tonight- I'll deal with the first general case next time. Thanks for tuning in. (apologies, I misspelled "diagonal" in the picture)
Gamblers roll the dice; Traders load the dice.
Synth Trendlines
Having declared war on time, the next thing Hudson challenged was the haphazard way that trendlines get drawn. Everybody's got a method- I'm not picking on anybody's method, as long as it works for you. What he thought was that there should be a standard model. But the sticky part (again) was getting rid of either time or price.
We all know how to draw trendlines. But these methods introduce the hazard of creating infinite colinear functions because it incorporates time at an infinity of points. And the same could be said of price, though arguably as a “smaller infinity” of colinearities because the likely price range is smaller than the time range.
So he makes this intuitive leap: that there's a causal and intimate relationship between three points in two mutually exclusive cases.
The first general case was the differences in price between a High and any two Lows either side of it and below it (or the differences between a Low and any two Highs either side of it and above it). This approach extinguished time from the calculation along with any colinearity risk.
The second general case was the differences in time between a High and any two Lows either side of it and below it (or the differences in time between a Low and any two Highs either side of it and above it). This approach extinguished price from the calculation along with any colinearity risk.
Let's take up the second general case first, that of time. In the image below, note that price is nowhere present in the calculation, except as giving us inflection Anchors CDE. You can draw your own conclusions about the value of this method from the picture. Enough for tonight- I'll deal with the first general case next time. Thanks for tuning in. (apologies, I misspelled "diagonal" in the picture)
Gamblers roll the dice; Traders load the dice.
|
Re: Synthetic Trendlines and FLIR January 21, 2016 08:43PM |
Registered: 8 years ago Posts: 161 |
Almost forgot about those /CL Hourly forecasts from a couple posts ago. Results:
All 11 inflections were TRUE, either exact or with 1 period slippage as predicted.
The speculation that these inflections would be followed by the same number of reversal bars as their corresponding inflections to the left of A proved to be "substantially TRUE" in >50% of cases. Here's the chart:

Gamblers roll the dice; Traders load the dice.
All 11 inflections were TRUE, either exact or with 1 period slippage as predicted.
The speculation that these inflections would be followed by the same number of reversal bars as their corresponding inflections to the left of A proved to be "substantially TRUE" in >50% of cases. Here's the chart:
Gamblers roll the dice; Traders load the dice.
|
Re: Synthetic Trendlines and FLIR January 22, 2016 12:10AM |
Registered: 8 years ago Posts: 161 |
In the previous post on Synthetic Trendlines, I showed how Hudson extinguished Price from the computation and kept only Time, i.e., his Second General Case. In that case, we saw that Time gave us support and resistance (S/R) for Price. Now let's deal with the First General Case, wherein Time is excluded- and perhaps we'll see that Price gives us certain upper and lower limits on Time. In effect, these two values are like conspiring criminals; we interrogate them in separate rooms and they rat each other out.
In the chart below, I used the vertical distances (price differences) between C and D, and D and E to create the sides of the box, thereby excluding time. The diagonal is the ST(price). I should mention that as time passes, the relevance of any ST (time or price) begins to fade and new ones must be created.

So those are the basics of FLIR and Synthetic Trendlines. Personally, though STs can be very useful, I thnk I like FLIR best. So my hope is for someone to give us code for plotting a FLIR. Also, please post any tests of either one so we can see results. Thank you.
Gamblers roll the dice; Traders load the dice.
In the chart below, I used the vertical distances (price differences) between C and D, and D and E to create the sides of the box, thereby excluding time. The diagonal is the ST(price). I should mention that as time passes, the relevance of any ST (time or price) begins to fade and new ones must be created.
So those are the basics of FLIR and Synthetic Trendlines. Personally, though STs can be very useful, I thnk I like FLIR best. So my hope is for someone to give us code for plotting a FLIR. Also, please post any tests of either one so we can see results. Thank you.
Gamblers roll the dice; Traders load the dice.
|
Re: Synthetic Trendlines and FLIR January 22, 2016 08:47AM |
Registered: 10 years ago Posts: 21 |
|
Re: Synthetic Trendlines and FLIR January 22, 2016 02:41PM |
Registered: 8 years ago Posts: 161 |
robertc777, no. Each chart shown is just a screenshot of an actual chart. In some charts shown I'm showing backtesting. But one chart (FLIR Results) for /CL is forward testing. In that one, I made the forecasts in an earlier post, then just waited to see how accurate it was- and it was very accurate. The way that was done was to draw the two trendlines (I posted the times of the tops and bottoms used) and count the number of bars from the intersect to inflections left of the intersect; then, I simply counted the same number of bars to the right of the intersect and waited to see what would happen at those bars. I've never seen anything so elegantly destroy the myth of market randomness.Quote
robertc777
-------------------------------------------------------
> baffled1,
>
> Hard to grasp, but I'm trying to follow your plots
> and drawings. When you plot the future, are the
> candles a direct replica of the past just rotated?
Gamblers roll the dice; Traders load the dice.
Edited 1 time(s). Last edit at 01/22/2016 02:43PM by baffled1.
|
Re: Synthetic Trendlines and FLIR January 24, 2016 07:58AM |
Registered: 8 years ago Posts: 61 |
|
Re: Synthetic Trendlines and FLIR January 25, 2016 09:54AM |
Registered: 8 years ago Posts: 161 |
Thanks, Tamp. I trader FLIR twice this morning on EURUSD. Did well. Also traded it last night but I was sloppy with measurements and lost some. I'd like to see somebody run FLIR on /ES and let's see what happens.Quote
Tampman
-------------------------------------------------------
> B - I'm watching you on this... nice work. looks
> promising.. Keep the updates coming.
Gamblers roll the dice; Traders load the dice.
|
Re: Synthetic Trendlines and FLIR January 26, 2016 10:15PM |
Registered: 10 years ago Posts: 21 |
Baffled1,
I have been trying to mark locations on TOS, and I have been using the Cycle Brackets to mark the left side of the chart. I have made a few predictions for OIL ( low )1/27 13:30, and ( high )1/28 around 11:30 . Let me know if I am on the right track. First time loading an image, so hope it works.

Edited 3 time(s). Last edit at 01/26/2016 10:25PM by robertc777.
I have been trying to mark locations on TOS, and I have been using the Cycle Brackets to mark the left side of the chart. I have made a few predictions for OIL ( low )1/27 13:30, and ( high )1/28 around 11:30 . Let me know if I am on the right track. First time loading an image, so hope it works.
Edited 3 time(s). Last edit at 01/26/2016 10:25PM by robertc777.
|
Re: Synthetic Trendlines and FLIR January 27, 2016 03:28AM |
Registered: 8 years ago Posts: 161 |
robertc777, wowwww.... I never even heard of Cycle Brackets. You forced me to just watch about 40 minutes of Bierman on this. I copied your chart and checked your two future FLIR placements- great job. Thank you. I'll be watching to see how this goes. For a moment, though, I wondered what the contribution of FLIR is, since Cycle Brackets mark the inflections so well. But haviing watched the videos I understand that cycle length settings are subjective, so FLIR can be used to render them objective.Quote
robertc777
> Baffled1,
>
> I have been trying to mark locations on TOS, and I
> have been using the Cycle Brackets to mark the
> left side of the chart. I have made a few
> predictions for OIL ( low )1/27 13:30, and ( high
> )1/28 around 11:30 . Let me know if I am on the
> right track. First time loading an image, so hope
> it works...
Gamblers roll the dice; Traders load the dice.
|
Re: Synthetic Trendlines and FLIR February 02, 2016 09:22PM |
Registered: 8 years ago Posts: 161 |
Okay, I've now been successfully trading the same FLIR setup for about 190 hours east of A intersect. Altogether about 14 trades on H1 EURUSD chart, maybe 2 small losses. Most of the trades were FLIR-based:
Trendline TOPS: 1/20 3am to 1/21 2am
Trendline BOTTOMS: 1/19 6am to 1/20 7pm
A-Intersect: 1/21/16 10pm
Darn, it still works but guess I oughta draw a couple new trendlines, eh? SIGH- work work work.

Gamblers roll the dice; Traders load the dice.
Edited 1 time(s). Last edit at 02/02/2016 10:34PM by baffled1.
Trendline TOPS: 1/20 3am to 1/21 2am
Trendline BOTTOMS: 1/19 6am to 1/20 7pm
A-Intersect: 1/21/16 10pm
Darn, it still works but guess I oughta draw a couple new trendlines, eh? SIGH- work work work.
Gamblers roll the dice; Traders load the dice.
Edited 1 time(s). Last edit at 02/02/2016 10:34PM by baffled1.
|
Re: Synthetic Trendlines and FLIR February 23, 2016 12:26PM |
Registered: 8 years ago Posts: 161 |
robertc777 Wrote:
-------------------------------------------------------
> Baffled1,
>
> I have been trying to mark locations on TOS, and I
> have been using the Cycle Brackets to mark the
> left side of the chart. I have made a few
> predictions for OIL ( low )1/27 13:30, and ( high
> )1/28 around 11:30 ...
===========================================
robertc777, nice work! I just remembered to look back to see how you did.

Gamblers roll the dice; Traders load the dice.
-------------------------------------------------------
> Baffled1,
>
> I have been trying to mark locations on TOS, and I
> have been using the Cycle Brackets to mark the
> left side of the chart. I have made a few
> predictions for OIL ( low )1/27 13:30, and ( high
> )1/28 around 11:30 ...
===========================================
robertc777, nice work! I just remembered to look back to see how you did.
Gamblers roll the dice; Traders load the dice.
|
Re: Synthetic Trendlines and FLIR February 24, 2016 09:13PM |
Registered: 10 years ago Posts: 21 |
|
Re: Synthetic Trendlines and FLIR February 24, 2016 10:39PM |
Registered: 8 years ago Posts: 161 |
robertc777 Wrote:
-------------------------------------------------------
> Baffled1,
>
> I played it today on AERI on a 8 min chart. I
> forecasted that the stock would be down in the
> morning session, and that it would rally by lunch
> time. It performed perfect. You got me hooked
>
> Thanks for starting a great Topic
=========================
robertc777, excellent! Glad it's helping somebody and thanks for posting about it. Keep up the good work and good luck to you!

Gamblers roll the dice; Traders load the dice.
-------------------------------------------------------
> Baffled1,
>
> I played it today on AERI on a 8 min chart. I
> forecasted that the stock would be down in the
> morning session, and that it would rally by lunch
> time. It performed perfect. You got me hooked
>
> Thanks for starting a great Topic
=========================
robertc777, excellent! Glad it's helping somebody and thanks for posting about it. Keep up the good work and good luck to you!
Gamblers roll the dice; Traders load the dice.
Sorry, only registered users may post in this forum.
Trade with Knowledge, Trade with Power - ResearchTrade.com.