Home
>
Trading Discussion
>
Topic
Please help with thinkscript indicator not always plotting
Posted by Dly206
|
Please help with thinkscript indicator not always plotting October 28, 2014 08:53AM |
Registered: 9 years ago Posts: 2 |
Hi,
I am new to this trying to learn thinkscript. I have a indicator that I have set up and it seems to work fine when it does plot but when I am looking back I notice multiple points where all the conditions for the indicator were met and it did not plot for some reason can someone please help let me know what is going on?
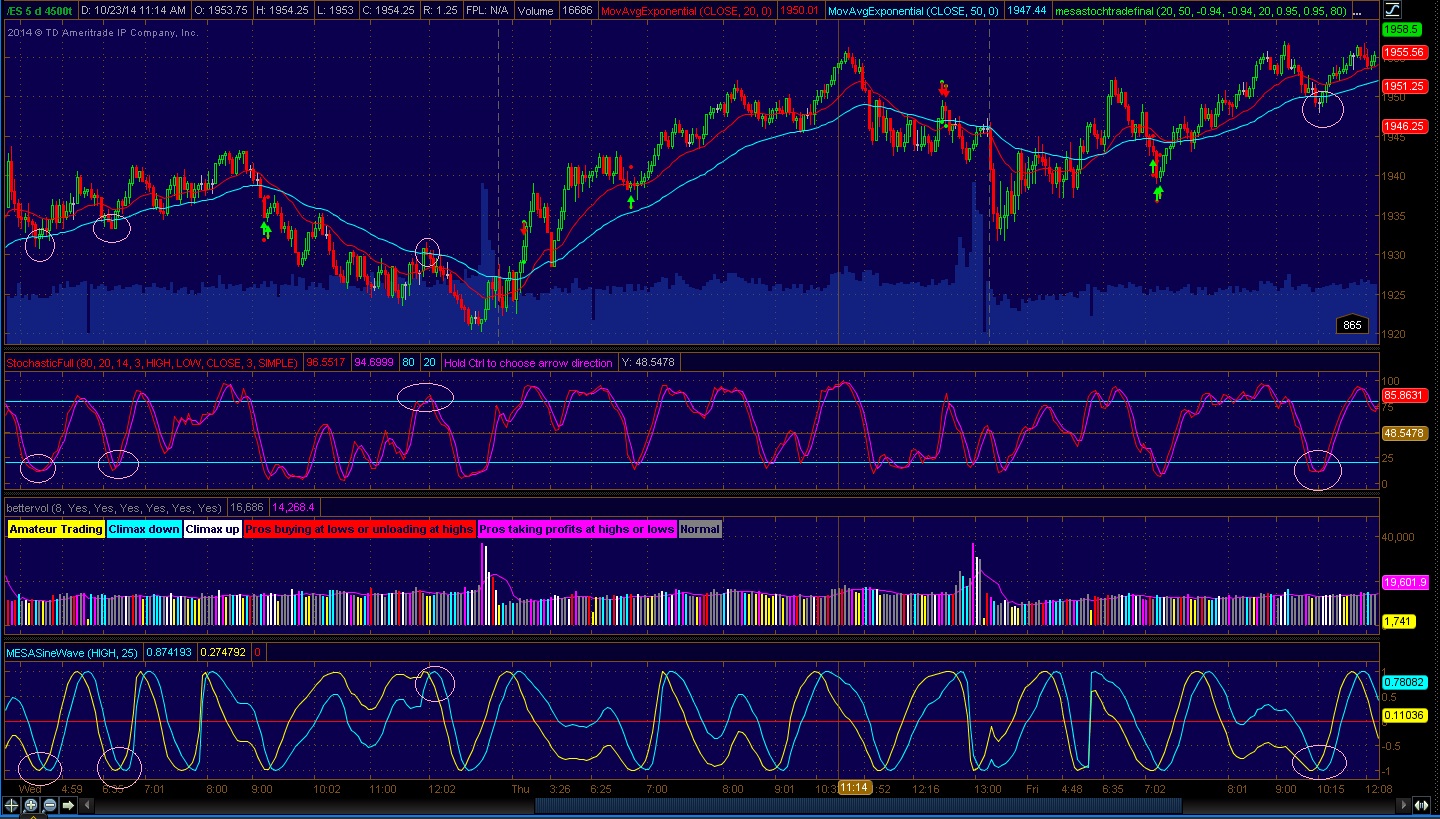
This is for /ES on a 4500t chart.
i posted the script I am using and a picture of the chart with the spots circled where i think it should show up and does not.
Thanks in advance.
the script:
input FastMA = 20;
input SlowMA = 50;
input Leadlow= -0.95;
input Sinelow = -0.95;
input Stochlow = 20;
input leadhigh = 0.95;
input sinehigh = 0.95;
input stochhigh = 80;
# long conditions
Def uptrend = MovAvgExponential("length" = fastma) is greater than Movavgexponential("length" = slowma);
def stochlong = StochasticFull("k period" = 3, "d period" = 14)."fullk" <= stochlow;
def sinelong = MESASineWave("price" = open)."sine wave" < sinelow;
def leadlong = MESASineWave("price" = open)."lead wave" < leadlow;
def wavelong = sinelong or lead long;
# short conditions
def downtrend = MovAvgExponential("length" = Fastma) is less than Movavgexponential("length" = slowma);
def stochshort = StochasticFull("k period" = 3, "d period" = 14)."FullK" >= stochhigh;
def sineshort = MESASineWave("price" = open)."sine wave" > sinehigh;
def leadshort = MESASineWave("price" = open)."lead wave" > leadhigh;
def waveshort = sineshort or leadshort;
# plots
plot ArrowUp = if uptrend and stochlong and wavelong then 1 else double.nan;
plot ArrowDown = if downtrend and stochshort and waveshort then 1 else double.nan;
plot longstop = if arrowup then (close - 3) else Double.NaN;
plot longprofit = if arrowup then (close + 2) else Double.NaN;
plot shortstop = if arrowdown then (close + 3) else Double.NaN;
plot shortprofit = if arrowdown then (close - 2) else Double.NaN;
ArrowUp.SetPaintingStrategy(PaintingStrategy.BOOLEAN_ARROW_UP);
ArrowDown.SetPaintingStrategy(PaintingStrategy.BOOLEAN_ARROW_DOWN);
longstop.SetPaintingStrategy(PaintingStrategy.points);
shortstop.SetPaintingStrategy(PaintingStrategy.points);
shortprofit.SetPaintingStrategy(PaintingStrategy.points);
longprofit.SetPaintingStrategy(PaintingStrategy.points);
Edited 1 time(s). Last edit at 10/28/2014 10:29AM by Dly206.
I am new to this trying to learn thinkscript. I have a indicator that I have set up and it seems to work fine when it does plot but when I am looking back I notice multiple points where all the conditions for the indicator were met and it did not plot for some reason can someone please help let me know what is going on?
This is for /ES on a 4500t chart.
i posted the script I am using and a picture of the chart with the spots circled where i think it should show up and does not.
Thanks in advance.
the script:
input FastMA = 20;
input SlowMA = 50;
input Leadlow= -0.95;
input Sinelow = -0.95;
input Stochlow = 20;
input leadhigh = 0.95;
input sinehigh = 0.95;
input stochhigh = 80;
# long conditions
Def uptrend = MovAvgExponential("length" = fastma) is greater than Movavgexponential("length" = slowma);
def stochlong = StochasticFull("k period" = 3, "d period" = 14)."fullk" <= stochlow;
def sinelong = MESASineWave("price" = open)."sine wave" < sinelow;
def leadlong = MESASineWave("price" = open)."lead wave" < leadlow;
def wavelong = sinelong or lead long;
# short conditions
def downtrend = MovAvgExponential("length" = Fastma) is less than Movavgexponential("length" = slowma);
def stochshort = StochasticFull("k period" = 3, "d period" = 14)."FullK" >= stochhigh;
def sineshort = MESASineWave("price" = open)."sine wave" > sinehigh;
def leadshort = MESASineWave("price" = open)."lead wave" > leadhigh;
def waveshort = sineshort or leadshort;
# plots
plot ArrowUp = if uptrend and stochlong and wavelong then 1 else double.nan;
plot ArrowDown = if downtrend and stochshort and waveshort then 1 else double.nan;
plot longstop = if arrowup then (close - 3) else Double.NaN;
plot longprofit = if arrowup then (close + 2) else Double.NaN;
plot shortstop = if arrowdown then (close + 3) else Double.NaN;
plot shortprofit = if arrowdown then (close - 2) else Double.NaN;
ArrowUp.SetPaintingStrategy(PaintingStrategy.BOOLEAN_ARROW_UP);
ArrowDown.SetPaintingStrategy(PaintingStrategy.BOOLEAN_ARROW_DOWN);
longstop.SetPaintingStrategy(PaintingStrategy.points);
shortstop.SetPaintingStrategy(PaintingStrategy.points);
shortprofit.SetPaintingStrategy(PaintingStrategy.points);
longprofit.SetPaintingStrategy(PaintingStrategy.points);
Edited 1 time(s). Last edit at 10/28/2014 10:29AM by Dly206.
|
Re: Please help with thinkscript indicator not always plotting October 28, 2014 10:07AM |
Registered: 10 years ago Posts: 615 |
After a cursory look at your script, I believe "Movexponential" at the end of these two lines should be changed to "MovAvgExponential".
Def uptrend = MovAvgExponential("length" = fastma) is greater than Movexponential("length" = slowma);

...

def downtrend = MovAvgExponential("length" = Fastma) is less than Movexponential("length" = slowma);
|
Re: Please help with thinkscript indicator not always plotting October 28, 2014 10:32AM |
Registered: 9 years ago Posts: 2 |
Ah right thank you for pointing that out, I had corrected that in the script just forgot to update it on the post. But this still is missing the spots where it should be plotting. I am trying to have this plot of at any point during a bar these conditions are met. In fact when I watch this in real time I will see the arrow plot for a second in these spots sometimes then go away by the time the bar closes.
Is there something I am missing to make the arrow stay once the conditions are met?
Is there something I am missing to make the arrow stay once the conditions are met?
Sorry, only registered users may post in this forum.
Trade with Knowledge, Trade with Power - ResearchTrade.com.