Fun with ThinkScript
Posted by robert
|
Re: Fun with ThinkScript June 27, 2014 04:11PM |
Registered: 10 years ago Posts: 143 |
Hi Linter,
The following code will:
1. Plot yesterday's high and low
2. Plot a dashed line just below and just above #1
3. Plot 5 min open range high and low
4. Plot a dashed line just below and just above #3
5. Plot 30 min open range high and low
6. Plot a dashed line just below and just above #5
7. Give you an audible and written alert whenever price closes above high dashed lines or below low dashed lines.
script OpenRange {
input ORtime = 5;
def FirstBar = secondsfromtime(0930) >= 0 and secondsfromtime(0930) < 60;
def RangeTime = SecondsFromTime(0930) >= 0 and SecondsFromTime(0930) < 60 * ORtime;
def Rhigh = if FirstBar then high else if RangeTime and high > Rhigh[1] then high else Rhigh[1];
def Rlow = if FirstBar then low else if RangeTime and low < Rlow[1] then low else Rlow[1];
plot h = if RangeTime or secondstilltime(0930) > 0 then Double.NaN else Rhigh;
plot l = if RangeTime or secondstilltime(0930) > 0then Double.NaN else Rlow;
}
def first30 = SecondsFromTime(0930) >= 0 and SecondsTillTime(1000) >= 0;
def today = GetLastDay() == GetDay();
def ATR = AvgTrueRange(high, close, low, 10);
plot yHigh = if !today then Double.NaN else high(period = "day" )[1];
yHigh.SetDefaultColor(Color.CYAN);
plot NearyHigh = if !today then Double.Nan else yHigh - ATR;
NearyHigh.SetStyle(Curve.SHORT_DASH);
NearyHigh.SetDefaultColor(Color.CYAN);
plot yLow = if !today then Double.NaN else low(period = "day" )[1];
yLow.SetDefaultColor(Color.PINK);
plot NearyLow = if !today then Double.Nan else yLow + ATR;
NearyLow.SetStyle(Curve.SHORT_DASH);
NearyLow.SetDefaultColor(Color.PINK);
plot h5 = if !today then Double.NaN else if !first30 then Double.NaN else OpenRange(5).h;
h5.SetDefaultColor(Color.YELLOW);
plot Nearh5 = if !today then Double.Nan else if !first30 then Double.NaN else h5 - ATR;
Nearh5.SetStyle(Curve.SHORT_DASH);
Nearh5.SetDefaultColor(Color.YELLOW);
plot l5 = if !today then Double.NaN else if !first30 then Double.NaN else OpenRange(5).l;
l5.SetDefaultColor(Color.YELLOW);
plot Nearl5 = if !today then Double.Nan else if !first30 then Double.NaN else l5 + ATR;
Nearl5.SetStyle(Curve.SHORT_DASH);
Nearl5.SetDefaultColor(Color.YELLOW);
plot h30 = if !today then Double.NaN else OpenRange(30).h;
h30.SetDefaultColor(Color.YELLOW);
plot Nearh30 = if !today then Double.Nan else h30 - ATR;
Nearh30.SetStyle(Curve.SHORT_DASH);
Nearh30.SetDefaultColor(Color.YELLOW);
plot l30 = if !today then Double.NaN else OpenRange(30).l;
l30.SetDefaultColor(Color.YELLOW);
plot Nearl30 = if !today then Double.Nan else l30 + ATR;
Nearl30.SetStyle(Curve.SHORT_DASH);
Nearl30.SetDefaultColor(Color.YELLOW);
def NyHigh = close > NearyHigh;
def NyLow = close < NearyLow;
def Nh5 = close > Nearh5;
def Nl5 = close < Nearl5;
def Nh30 = close > Nearh30;
def Nl30 = close < Nearl30;
Alert(NyHigh[1], GetSymbolPart() + " near yesterday's high " ), Alert.BAR, Sound.Ding);
Alert(NyLow[1], GetSymbolPart() + " near yesterday's low " ), Alert.BAR, Sound.Ding);
Alert(Nh5[1], GetSymbolPart() + " near 5 min open range high " ), Alert.BAR, Sound.Ding);
Alert(Nl5[1], GetSymbolPart() + " near 5 min open range low " ), Alert.BAR, Sound.Ding);
Alert(Nh30[1], GetSymbolPart() + " near 30 min open range high " ), Alert.BAR, Sound.Ding);
Alert(Nl30[1], GetSymbolPart() + " near 30 min open range low " ), Alert.BAR, Sound.Ding);
|
Re: Fun with ThinkScript June 27, 2014 04:18PM |
Registered: 10 years ago Posts: 143 |
|
Re: Fun with ThinkScript June 27, 2014 04:21PM |
Registered: 10 years ago Posts: 615 |

|
Re: Fun with ThinkScript June 27, 2014 04:58PM |
Registered: 9 years ago Posts: 78 |
|
Re: Fun with ThinkScript June 27, 2014 05:05PM |
Registered: 10 years ago Posts: 615 |
Quote
eurekaaaa
Next it's not necessarily the 1st bar back that inband needs to be >= MinDaysInband , it could be one, two, three or more bars back depending on how many days the stock closed outside of the Bollinger bands.
Eric,
Thanks for finding the error in logic. This updated code should work better for you.

input length = 21;
input MinDaysInband = 15;
def sDev = StDev(data = close, length = length);
def Avg = Average(close, length);
def UpperBand = Avg + 2 * sDev;
def LowerBand = Avg - 2 * sDev;
def inband = if close < UpperBand and close > LowerBand then inband[1] + 1 else 0;
def outband = if inband then 0 else if (inband[1] >= MinDaysInband or outband[1] >= 1) then outband[1] + 1 else 0;

AddLabel(inband >= MinDaysInband, "In BB: " + inband, Color.BLACK);
AddLabel(outband, "Out BB: " + outband, Color.WHITE);

# delete this line and the two below if NOT used as a watchlist column
AddLabel(inband < MinDaysInband and !outband, " ", Color.CURRENT);
AssignBackgroundColor(if inband >= MinDaysInband then Color.DARK_ORANGE else if outband then Color.PLUM else Color.CURRENT);
- robert

Professional ThinkorSwim indicators for the average Joe
Edited 1 time(s). Last edit at 06/27/2014 05:10PM by robert.
|
Re: Fun with ThinkScript June 28, 2014 01:39PM |
Registered: 10 years ago Posts: 615 |
Quote
Bryce3000
I was wondering if anyone happen to know a way to quickly seach for the following.
Scan for for stocks that have the following.
1) Look at the past earnings (Choose how many earnings you go back, minimum of three earnings.
2) Look for stocks that were always going up PRIOR to earnings for at least a 10% difference from the day before earnings.
3) Look for stocks that were always going down PRIOR to earnings for at least a 10% difference from the day before earnings.
4) Look for stocks that were always going down AFTER to earnings for at least a 10% difference from the day after earnings.
5) Look for stocks that were always going up AFTER to earnings for at least a 10% difference from the day after earnings.
The reason I mention the day before or after is because if you include the earnings date within the mathmatical equation it would be scewed due to to gap ups and downs that earnings produces.
Alternative to this search method would be some sort of color, arrow, etc.. that indicates the direction the trend is going as long as the following is true.
1) There is a 10% difference from the first candlestick to the candlestick right before earnings or after earnings.
Any ideas?
A few years back, I wrote a ruby script that would download the historical quotes and earnings dates for a list of stocks (about 2,000). I then had an excel spreadsheet that used a combination of visual basic scripting and excel magic that processed the data and generated a sortable summary table and detailed quarterly reports for each of those stocks.


Both the primary and backup websites that I was using for historical earnings data have stopped providing that information publicly, at least not for free; so the ruby script no longer downloads earnings data. The portion of the script that downloaded the historical quotes does still function properly (at least it did the last time I ran it a few months ago).
I am no longer interested in pursuing this line of research. Included in the link below is the ruby script, excel spreadsheet, and all the data that was last updated during the summer of last year. If you comb through and deconstruct the spreadsheet and scripts perhaps you'll generate ideas which will allow you to move forward on your own. Both my VB and ruby scripts are commented well so you should be able to figure out what is going on. From within the excel spreadsheet, running the "GetData" macro will ask for a ticker symbol then generate the quarterly reports for that symbol as long as the data is available in enclosed historical folders.
Do with this as you please, but I will not provide assistance or answer questions regarding its use.
[www.mediafire.com]
|
Re: Fun with ThinkScript June 28, 2014 02:23PM |
Registered: 9 years ago Posts: 78 |
hey tan and robt:
in the above study, i am getting 'invalid statement' errors with the alerts. anything obviously wrong jump out at ya'll?
Alert(NyHigh[1], GetSymbolPart() + " near yesterday's high " ), Alert.BAR, Sound.Ding);
Alert(NyLow[1], GetSymbolPart() + " near yesterday's low " ), Alert.BAR, Sound.Ding);
Alert(Nh5[1], GetSymbolPart() + " near 5 min open range high " ), Alert.BAR, Sound.Ding);
Alert(Nl5[1], GetSymbolPart() + " near 5 min open range low " ), Alert.BAR, Sound.Ding);
Alert(Nh30[1], GetSymbolPart() + " near 30 min open range high " ), Alert.BAR, Sound.Ding);
Alert(Nl30[1], GetSymbolPart() + " near 30 min open range low " ), Alert.BAR, Sound.Ding);
|
Re: Fun with ThinkScript June 28, 2014 02:34PM |
Registered: 10 years ago Posts: 615 |
|
Re: Fun with ThinkScript June 28, 2014 02:49PM |
Registered: 9 years ago Posts: 9 |
|
Re: Fun with ThinkScript June 28, 2014 02:57PM |
Registered: 10 years ago Posts: 615 |
|
Re: Fun with ThinkScript June 28, 2014 03:00PM |
Registered: 10 years ago Posts: 143 |
Linter sorry about that. Originally Robert used concat in his scripts and later he started using the more elegant "+" without concat. The concat code had 2 extra bracket symbols. I used the "+" method and didn't use the first bracket, but forgot that you don't need the second bracket " )". Silly amateur error!
Edited 1 time(s). Last edit at 06/28/2014 03:01PM by tanman.
Edited 1 time(s). Last edit at 06/28/2014 03:01PM by tanman.
|
Re: Fun with ThinkScript June 29, 2014 11:49AM |
Registered: 9 years ago Posts: 9 |
|
Re: Fun with ThinkScript June 29, 2014 02:20PM |
Registered: 9 years ago Posts: 9 |
Normally in TOS my settings are Intraday 1 Day 5min, 15min or 30min. I usually act off of the Low's and High's of that period (1 day) by setting a email or text alert when the new High or Low is hit.
Is there why to make an alert that can be made to automatically do this when a new High or low is hit? instead of having to do it manually set this every time a new high or low is hit.
Is there why to make an alert that can be made to automatically do this when a new High or low is hit? instead of having to do it manually set this every time a new high or low is hit.
|
Re: Fun with ThinkScript June 29, 2014 03:22PM |
Registered: 10 years ago Posts: 615 |
Quote
wiineedmore
Is there why to make an alert that can be made to automatically do this when a new High or low is hit? instead of having to do it manually set this every time a new high or low is hit.
You asked for this and I wrote it for you a month ago. [www.researchtrade.com]
|
Re: Fun with ThinkScript June 29, 2014 04:00PM |
Registered: 9 years ago Posts: 9 |
robert Wrote:
-------------------------------------------------------
> > Is there why to make an alert that can be made
> to automatically do this when a new High or low is
> hit? instead of having to do it manually set this
> every time a new high or low is hit.
>
> You asked for this and I wrote it for you a month
> ago.
> [www.researchtrade.com]
> ,3343#msg-3343
Ahhh yes I see, I didn't realize that I could set the email based off of the alert, lmbo boy did I blow that one. I am looking at the EUR/USD, and my normal background is Black it is currently white (the market is closed but it still reads) can this shut off say after 10min (color goes back to default). For example the High on the 1day 5min charts Hit at 16:30 Est charts last time is 1700 or 1655 maybe the background can clear and reset for the next High or Low.
|
Re: Fun with ThinkScript June 29, 2014 04:47PM |
Registered: 10 years ago Posts: 615 |
Quote
wiidneedmore
can this shut off say after 10min (color goes back to default). For example the High on the 1day 5min charts Hit at 16:30 Est charts last time is 1700 or 1655 maybe the background can clear and reset for the next High or Low.
It should reset to the default chart color when the next bar paints; so if you are on a 10 min chart, it'll be 10 minutes; 2 min chart, 2 minutes; unless the next bar is higher still. There isn't a way of telling it to reset any sooner than the bar's time period.
|
Re: Fun with ThinkScript June 29, 2014 08:00PM |
Registered: 9 years ago Posts: 9 |
robert Wrote:
-------------------------------------------------------
> > can this shut off say after 10min (color goes
> back to default). For example the High on the 1day
> 5min charts Hit at 16:30 Est charts last time is
> 1700 or 1655 maybe the background can clear and
> reset for the next High or Low.
>
>
> It should reset to the default chart color when
> the next bar paints; so if you are on a 10 min
> chart, it'll be 10 minutes; 2 min chart, 2
> minutes; unless the next bar is higher still.
> There isn't a way of telling it to reset any
> sooner than the bar's time period.
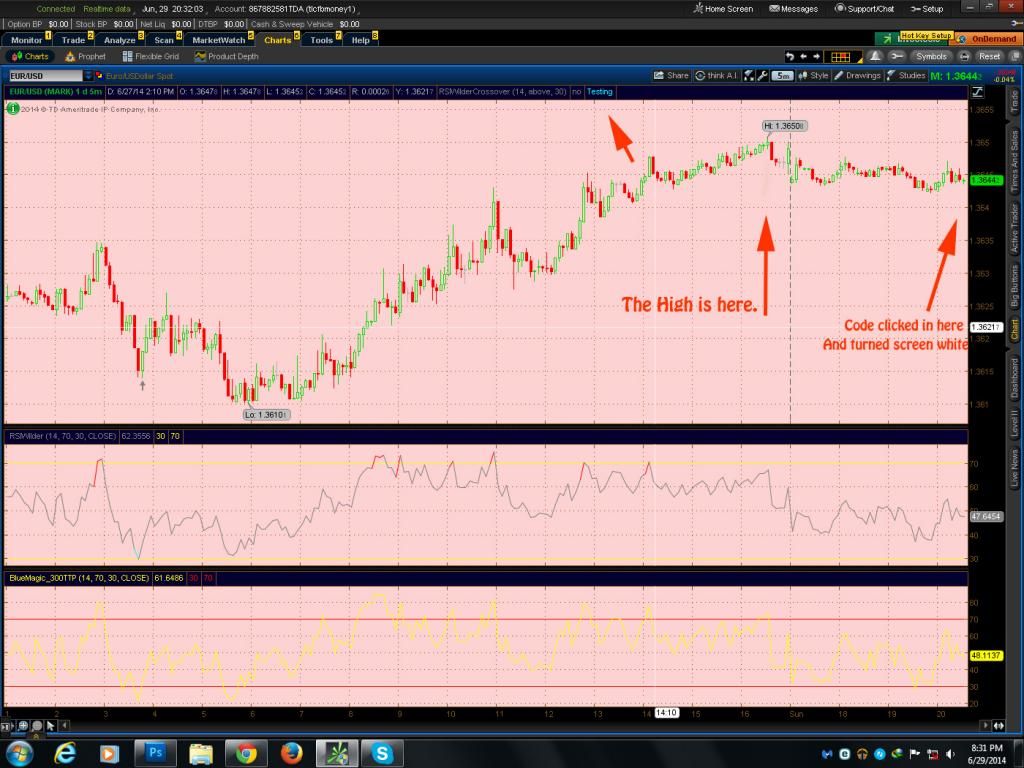
Excellent exactly what I was looking for as far as the reset but the alert itself is not picking the correct high or low. High Low <--- click for image
I hope this picture comes up, I think the program is not picking the correct High & low and normally my background is black as the alert turns it to white (Can you make it turn blue for the Low and the High).
Edited 2 time(s). Last edit at 06/29/2014 08:01PM by wiineedmore.
-------------------------------------------------------
> > can this shut off say after 10min (color goes
> back to default). For example the High on the 1day
> 5min charts Hit at 16:30 Est charts last time is
> 1700 or 1655 maybe the background can clear and
> reset for the next High or Low.
>
>
> It should reset to the default chart color when
> the next bar paints; so if you are on a 10 min
> chart, it'll be 10 minutes; 2 min chart, 2
> minutes; unless the next bar is higher still.
> There isn't a way of telling it to reset any
> sooner than the bar's time period.
Excellent exactly what I was looking for as far as the reset but the alert itself is not picking the correct high or low. High Low <--- click for image
I hope this picture comes up, I think the program is not picking the correct High & low and normally my background is black as the alert turns it to white (Can you make it turn blue for the Low and the High).
Edited 2 time(s). Last edit at 06/29/2014 08:01PM by wiineedmore.
|
Re: Fun with ThinkScript June 29, 2014 09:22PM |
Registered: 10 years ago Posts: 615 |
Quote
wiineedmore
the alert itself is not picking the correct high or low.
Coding error. Thanks for pointing it out. This should sort things for you.
def dayHigh = if GetDay() != GetDay()[1] then high else if high > dayHigh[1] then high else dayHigh[1];
def dayLow = if GetDay() != GetDay()[1] then low else if low < dayLow[1] then low else dayLow[1];

AssignBackgroundColor(if high > dayHigh[1] then Color.BLUE else if low < dayLow[1] then Color.BLUE else Color.CURRENT);

Alert(high > dayHigh[1], Concat(GetSymbolPart(), " has a new intraday high." ), Alert.BAR, Sound.Ring);
Alert(low < dayLow[1], Concat(GetSymbolPart(), " has a new intraday low." ), Alert.BAR, Sound.Ring);
Quote
Can you make it turn blue for the Low and the High
Done. If you decide you want a different color, just change "Color.BLUE" in the code to any of the thinkscript color codes below.

|
Re: Fun with ThinkScript June 29, 2014 10:27PM |
Registered: 9 years ago Posts: 9 |
robert Wrote:
-------------------------------------------------------
> > the alert itself is not picking the correct high
> or low.
>
>
> Coding error. Thanks for pointing it out. This
> should sort things for you.
>
>
> def dayHigh = if GetDay() != GetDay()[1] then high
> else if high > dayHigh[1] then high else
> dayHigh[1];
> def dayLow = if GetDay() != GetDay()[1] then low
> else if low < dayLow[1] then low else dayLow[1];
>
> AssignBackgroundColor(if high > dayHigh[1] then
> Color.BLUE else if low < dayLow[1] then Color.BLUE
> else Color.CURRENT);
>
> Alert(high > dayHigh[1], Concat(GetSymbolPart(), "
> has a new intraday high." ), Alert.BAR,
> Sound.Ring);
> Alert(low < dayLow[1], Concat(GetSymbolPart(), "
> has a new intraday low." ), Alert.BAR,
> Sound.Ring);
>
>
> Can you make it turn blue for the Low and the
> High
>
> Done. If you decide you want a different color,
> just change "Color.BLUE" in the code to any of the
> thinkscript color codes below.
>
> [i.imgur.com]
Freak'n Awesome! Thanks so much! Now I can find what color does hurt my eye or conflict with the candles. lmbo Thanks again
|
Re: Fun with ThinkScript June 30, 2014 12:16AM |
Registered: 9 years ago Posts: 9 |
Maybe the code still needs to be adjusted or may have used the wrong terminology, I am just looking for every new High of the (1 day) and low's. You know just the ones that create the white Bubbles that say Hi: ****** like right now the EUR/JPY Hi 138.492 maybe these are just called highs and lows not intraday? I am not fully sure. forgive me.
|
Re: Fun with ThinkScript June 30, 2014 06:50AM |
Registered: 10 years ago Posts: 615 |
Quote
wiineedmore
Maybe the code still needs to be adjusted or may have used the wrong terminology, I am just looking for every new High of the (1 day) and low's. You know just the ones that create the white Bubbles that say Hi: ****** like right now the EUR/JPY Hi 138.492 maybe these are just called highs and lows not intraday?
I have misunderstood what you are looking for. I would interpret this statement---I am just looking for every new High of the (1 day) and low's.---as being the high or low for today; which is what the script above is looking for. You then say that you are looking for the high or low that would be indicated by the bubble on the chart. If that's the case, then I believe what you are wanting is to be notified when a new high or low for the current charting period (the whole of what is displayed on the current chart) is reached.
If so, then see if this does what you want.
AssignBackgroundColor(if high == HighestAll(high) then Color.BLUE else if low == LowestAll(low) then Color.BLUE else Color.CURRENT);

Alert(high == HighestAll(high), GetSymbolPart() + " has a new intraday high.", Alert.BAR, Sound.Ring);
Alert(low == LowestAll(low), GetSymbolPart() + " has a new intraday low.", Alert.BAR, Sound.Ring);
|
Re: Fun with ThinkScript June 30, 2014 08:13AM |
Registered: 12 years ago Posts: 373 |
I do not know how many of you are actually using RTT research to assist you in finding trades, but it is a tool that is almost a must-if you are looking for one of the strongest forms of confirmation when trading from bigger charts. If historical research through RTT does not indicate that the stock will go in the direction of my trade, it is about a 90% chance I will not place a trade from a Daily or 233 Trend and 55 decision. It has become one of the indicators that I think is "a must". Think about it, if a stock has gone up 8 times in the last 8 years during a specific time frame, why would I trade against that trend? This reminds me of the analogy once mentioned- Barney Fife fighting Rambo.
The feature that allows me to set multiple alerts when a trend line is broken has proven to be very beneficial. Thanks to Robert, I have been able to set my notifications to alert me via audible and text message when a trend line is broken. As I continue to study and close in on a Swing Trading strategy (that works consistently), I will continue searching for tools that make life easier.
I think all trades are momentum trades-PERIOD! Some are short term momentum, but others are identified longer term momentum trades. My approach to trading never changes. I am aggressive and enjoy catching momentum swings. Right now, I have hard time dealing with watching and riding through "Red" days. The key is finding and developing strong support and resistance areas. Once those areas are compromised, it is time to get out. The loss tolerance levels are different and more mentally challenging. The good thing is, it always comes back in the direction I initially thought it would go, but sometimes, I have to sit on a position for a couple of weeks-OR MORE. That is pretty tough, but when it comes, it comes strong. Also, as time moves closer to expiration and the trades starts going in your direction, the strength of the position changes and the positive flow of money grows so much faster. I do not totally understand all of that, but I know, those who swing trade well, are knocking down some MAJOR, MAJOR $$$'s. I WILL GET IT!
You guys are doing some really great things regarding helping others. I really appreciate the help as well. As I continue trading intraday and practice Swing Trading, I will continue trying to find ways to take out some of the "Leg Work". I could not practice any of this if I did not have TOS, so I appreciate that free service.
Have a good day and trade well,
Rookie30
|
Re: Fun with ThinkScript July 02, 2014 07:03PM |
Registered: 9 years ago Posts: 5 |
TOS Ambush Fibonacci
this works great..does anybody know how to add a title/name to identify the fib levels...such
as the ones that are on price level drawings that you can hide/unhide?
this works great..does anybody know how to add a title/name to identify the fib levels...such
as the ones that are on price level drawings that you can hide/unhide?
|
Re: Fun with ThinkScript July 03, 2014 03:40PM |
Registered: 9 years ago Posts: 75 |
Hi Robert , thank you for your help 
Can you code this script to be in the Watch list with a label ( green BUY) and (red SELL) signals ?
Can you code this script to be in the Watch list with a label ( green BUY) and (red SELL) signals ?
# macd
def Value = MACD(2, 5, 2, "EMA" ).Value;
def Avg = MACD(2, 5, 2, "EMA" ).Avg;
def MACDup = Value > Avg;
def MACDdn = Value <= Avg;

# stochslow
def SlowD = StochasticFull(80, 30, 2, 2, hlc3, hlc3, hlc3, 3, "EMA" ).FullD;
def SlowDup = SlowD crosses above 30;
def SlowDdn = SlowD crosses below 80;

# CCI
def CCI = CCI(7);
def CCIup = CCI crosses above -100;
def CCIdn = CCI crosses below 100;

# MFI
def MFIup = MoneyFlowIndex(length = 1).MoneyFlowIndex crosses above 20;
def MFIdn = MoneyFlowIndex(length = 1).MoneyFlowIndex crosses below 80;

# RMI
def emaInc = ExpAverage(Max(close - close[5], 0), 2);
def emaDec = ExpAverage(Max(close[5] - close, 0), 3);
def RMI = if emaDec == 0 then 0 else 100 - 100 / (1 + emaInc / emaDec);
def RMIob = RMI >= 70;
def RMIos = RMI <= 30;

# Signals
plot signalUP = MACDup and SlowDup and CCIup and MFIup and RMIos;
     signalUP.SetPaintingStrategy(PaintingStrategy.BOOLEAN_ARROW_UP);
     signalUP.SetLineWeight(3);
     signalUP.SetDefaultColor(Color.LIGHT_GREEN);
plot signalDN = MACDdn and SlowDdn and CCIdn and MFIdn and RMIob;
     signalDN.SetPaintingStrategy(PaintingStrategy.BOOLEAN_ARROW_DOWN);
     signalDN.SetLineWeight(3);
     signalDN.SetDefaultColor(Color.PINK);
|
Re: Fun with ThinkScript July 05, 2014 01:17PM |
Registered: 12 years ago Posts: 321 |
Optiontrader101,
I created code for each signal. When I attempted to combine into one signal I get a reliability message. perhaps you can use these until someone more knowledgeable than I can address this issue.
LONG SIGNAL
# macd
def Value = MACD(2, 5, 2, "EMA" ).Value;
def Avg = MACD(2, 5, 2, "EMA" ).Avg;
def MACDup = Value > Avg;
def MACDdn = Value <= Avg;
# stochslow
def SlowD = StochasticFull(80, 30, 2, 2, hlc3, hlc3, hlc3, 3, "EMA" ).FullD;
def SlowDup = SlowD crosses above 30;
def SlowDdn = SlowD crosses below 80;
# CCI
def CCI = CCI(7);
def CCIup = CCI crosses above -100;
def CCIdn = CCI crosses below 100;
# MFI
def MFIup = MoneyFlowIndex(length = 1).MoneyFlowIndex crosses above 20;
def MFIdn = MoneyFlowIndex(length = 1).MoneyFlowIndex crosses below 80;
# RMI
def emaInc = ExpAverage(Max(close - close[5], 0), 2);
def emaDec = ExpAverage(Max(close[5] - close, 0), 3);
def RMI = if emaDec == 0 then 0 else 100 - 100 / (1 + emaInc / emaDec);
def RMIob = RMI >= 70;
def RMIos = RMI <= 30;
# Signals
PLOT SIGUP = MACDup and SlowDup and CCIup and MFIup and RMIos;
SIGUP.AssignvalueColor(IF SIGUP THEN COLOR.GREEN ELSE Color.WHITE);
AssignbackgroundColor(IF SIGUP THEN COLOR.GREEN ELSE Color.WHITE);
-----------------------------------------------------------------------------------------------------------------------------------------------------------
SHORT SIGNAL
# macd
def Value = MACD(2, 5, 2, "EMA" ).Value;
def Avg = MACD(2, 5, 2, "EMA" ).Avg;
def MACDup = Value > Avg;
def MACDdn = Value <= Avg;
# stochslow
def SlowD = StochasticFull(80, 30, 2, 2, hlc3, hlc3, hlc3, 3, "EMA" ).FullD;
def SlowDup = SlowD crosses above 30;
def SlowDdn = SlowD crosses below 80;
# CCI
def CCI = CCI(7);
def CCIup = CCI crosses above -100;
def CCIdn = CCI crosses below 100;
# MFI
def MFIup = MoneyFlowIndex(length = 1).MoneyFlowIndex crosses above 20;
def MFIdn = MoneyFlowIndex(length = 1).MoneyFlowIndex crosses below 80;
# RMI
def emaInc = ExpAverage(Max(close - close[5], 0), 2);
def emaDec = ExpAverage(Max(close[5] - close, 0), 3);
def RMI = if emaDec == 0 then 0 else 100 - 100 / (1 + emaInc / emaDec);
def RMIob = RMI >= 70;
def RMIos = RMI <= 30;
# Signals
PLOT SIGDN = MACDdn and SlowDdn and CCIdn and MFIdn and RMIob;
SIGDN.AssignvalueColor(IF SIGDN THEN COLOR.RED ELSE Color.WHITE);
AssignbackgroundColor(IF SIGDN THEN COLOR.RED ELSE Color.WHITE);
|
Re: Fun with ThinkScript July 05, 2014 09:32PM |
Registered: 9 years ago Posts: 4 |
Hello... I am new to the forum and to the TOS scripting...
I was trying to follow some examples from Robert to try and find the highest high but during pre-market hours.
I have the following:
def Today = if GetLastDay() == GetDay() then 1 else 0;
#Define the Pre-market trading time block between 4:00a.m. to 9:30a.m. EST
#plot preMrkTime = if secondsFromTime(0400) >= 0 and secondsTillTime(0930) > 0 then 1 else 0;
#Determine highest price within the pre-market time block
plot preMrktHigh = if Today and preMrktTime then HighestAll(high) else Double.Nan;
preMrktHigh.SetDefaultColor(color.red);
preMrktHigh.SetPaintingStrategy(PaintingStrategy.HORIZONTAL);
This does not seem to work and also, the line it draws does not stretch across the whole chart.
Could you kindly point me in the right direction?
Many thanks for your help.
|
Re: Fun with ThinkScript July 05, 2014 10:06PM |
Registered: 11 years ago Posts: 106 |
|
Re: Fun with ThinkScript July 06, 2014 06:52AM |
Registered: 10 years ago Posts: 615 |
NMR, that bit of code is a combination of several custom indicators that optionstrader101 uses and has nothing to do with the E charts. See page 7 of this thread for reference.
Mksurfer, I'm currently on vacation and posting from my ipad, so I'll help you out when I return later this week if you haven't figured things out by then.
In the mean time, "highestall" is not what you need because that will return the highest value from the current chart. For example, if the chart is set to a length of 10 days, then highestall will return the 10 day high. Likewise, for a 2 year chart, it will return the highest value over the past two years.
Take a look at this bit of code and try to figure out what is going on. You should be able to modify it to suit your needs.
Post back if you figure things out or if you run into further difficulties. A few users here are either coding already or are rapidly learning and should be able to help.
Mksurfer, I'm currently on vacation and posting from my ipad, so I'll help you out when I return later this week if you haven't figured things out by then.
In the mean time, "highestall" is not what you need because that will return the highest value from the current chart. For example, if the chart is set to a length of 10 days, then highestall will return the 10 day high. Likewise, for a 2 year chart, it will return the highest value over the past two years.
Take a look at this bit of code and try to figure out what is going on. You should be able to modify it to suit your needs.
script OpenRange {
    input ORtime = 5;

    def FirstBar = secondsfromtime(0930) >= 0 and secondsfromtime(0930) < 60;
    def RangeTime = SecondsFromTime(0930) >= 0 and SecondsFromTime(0930) < 60 * ORtime;
    def Rhigh = if FirstBar then high else if RangeTime and high > Rhigh[1] then high else Rhigh[1];
    def Rlow = if FirstBar then low else if RangeTime and low < Rlow[1] then low else Rlow[1];

    plot h = if RangeTime or secondstilltime(0930) > 0 then Double.NaN else Rhigh;
    plot l = if RangeTime or secondstilltime(0930) > 0then Double.NaN else Rlow;
}
Post back if you figure things out or if you run into further difficulties. A few users here are either coding already or are rapidly learning and should be able to help.
|
Re: Fun with ThinkScript July 06, 2014 02:04PM |
Registered: 9 years ago Posts: 4 |

|
Re: Fun with ThinkScript July 10, 2014 04:43PM |
Registered: 9 years ago Posts: 8 |
Hey all. I just wanted to add my thanks to Robert for all the great stuff you shared, I'm using much of it for my day trading and it's improved my ToS experience. I've been trying to figure out the scripting language and although I've been successful modifying working scripts, I'm stuck trying to create my own, if it's even possible.
What I'd like to add is the current VIX price as a chart label to my upper chart with colors ie: VIX > 12 RED, < 12 GREEN or something.
Thanks for any help.
What I'd like to add is the current VIX price as a chart label to my upper chart with colors ie: VIX > 12 RED, < 12 GREEN or something.
Thanks for any help.


Sorry, only registered users may post in this forum.
Trade with Knowledge, Trade with Power - ResearchTrade.com.