Fun with ThinkScript
Posted by robert
|
Re: Buy and Sell lines on chart of zigzag May 07, 2018 06:55PM |
Registered: 10 years ago Posts: 464 |
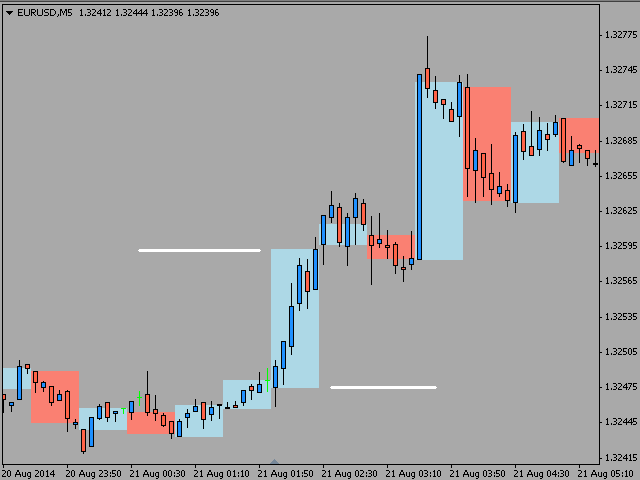
I hope everyone is aware that the ZigZag lines just like the Autowave is a big fat LIER!!!!! It tells the true AFTER THE FACT.
It will often take the line back and redraw it. As in the picture above it does appear to always be right. It's only right in hindsight. Based on the picture you could INCORRECTLY get the idea that the line is some sort of fortune teller line. It isn't.
It will often take the line back and redraw it. As in the picture above it does appear to always be right. It's only right in hindsight. Based on the picture you could INCORRECTLY get the idea that the line is some sort of fortune teller line. It isn't.
|
Re: Buy and Sell lines on chart of zigzag May 07, 2018 08:21PM |
Registered: 5 years ago Posts: 23 |
|
Re: Fun with ThinkScript May 07, 2018 09:05PM |
Registered: 5 years ago Posts: 1 |
|
Re: Buy and Sell lines on chart of zigzag May 08, 2018 07:14AM |
Registered: 5 years ago Posts: 23 |
|
Re: Buy and Sell lines on chart of zigzag May 08, 2018 04:07PM |
Registered: 7 years ago Posts: 126 |
Quote
optionmaster
ok is there a way to change the lines to bubbles that say buy, instead of the lines
Replace the addchartline with:
AddChartBubble(showBubbleschange and !IsNaN("ZZ$" ) and barNumber != 1, if isUp then high else low , "buy" , if barCount == barNumber or !isConf then GlobalColor("Unconfirmed" ) else if isUp then GlobalColor("Down" ) else GlobalColor("Up" ), isUp);
Edited 1 time(s). Last edit at 05/08/2018 04:10PM by rigel.
|
Re: Fun with ThinkScript May 09, 2018 12:20PM |
Registered: 5 years ago Posts: 23 |
|
3 Time frame chart with daily pivot points TOS May 10, 2018 01:31PM |
Registered: 5 years ago Posts: 23 |
|
Re: Fun with ThinkScript May 12, 2018 04:32AM |
Registered: 7 years ago Posts: 126 |

|
Need Scripting Help May 11, 2018 08:36PM |
Registered: 6 years ago Posts: 13 |
the following code produces the yellow dots in figure 1.
[imgur.com]
These are pivot areas. I want to auto draw a trendline to connect the last two dots of the lower high (red arrows) and a trendline to connect the last two higher low dots (green arrows) as in figure 2. I would like for these lines to be displayed until the next lower high or higher lows are formed. Any help is much appreciated
[imgur.com]
input numBars = 5;
input showLines = yes;
input showValues = yes;
input showBarNumbers = no;
input TrendResistanceStart = 0;
input TrendResistanceEnd = 0;
input TrendSupportStart = 0;
input TrendSupportEnd = 0;
def UserSetResistance = TrendResistanceStart > 0 and TrendResistanceEnd > 0;
def UserSetSupport = TrendSupportStart > 0 and TrendSupportEnd > 0;
def currentHigh = high;
def currentLow = low;
def currentBar = BarNumber();
def PH;
def PL;
def isHigherThanNextBars = fold i = 1 to numBars + 1 with p = 1
while p do currentHigh > GetValue(high, -i);
PH = if UserSetResistance and ( currentBar == TrendResistanceStart or currentBar == TrendResistanceEnd ) then currentHigh else if !UserSetResistance and (currentBar > numBars and currentHigh == Highest(currentHigh, numBars) and isHigherThanNextBars) then currentHigh else Double.NaN;
def isLowerThanNextBars = fold j = 1 to numBars + 1 with q = 1
while q do currentLow < GetValue(low, -j);
PL = if UserSetSupport and ( currentBar == TrendSupportStart or currentBar == TrendSupportEnd ) then currentLow else if !UserSetSupport and (currentBar > numBars and currentLow == Lowest(currentLow, numBars) and isLowerThanNextBars) then currentLow else Double.NaN;
rec PHBar = if UserSetResistance then TrendResistanceEnd else if !IsNaN(PH) then currentBar else PHBar[1];
rec PLBar = if UserSetSupport then TrendSupportEnd else if !IsNaN(PL) then currentBar else PLBar[1];
rec PHL = if !IsNaN(PH) then PH else PHL[1];
rec priorPHBar = if UserSetResistance then TrendResistanceStart else if PHL != PHL[1] then PHBar[1] else priorPHBar[1];
rec PLL = if !IsNaN(PL) then PL else PLL[1];
rec priorPLBar = if UserSetSupport then TrendSupportStart else if PLL != PLL[1] then PLBar[1] else priorPLBar[1];
def isFinalTwoHighPivots = currentBar >= HighestAll(priorPHBar);
def isFinalTwoLowPivots = currentBar >= HighestAll(priorPLBar);
def ResistanceFinishOffset = if isFinalTwoHighPivots then currentBar - PHBar else 0;
def ResistanceStartOffset = if isFinalTwoHighPivots then currentBar - priorPHBar else 0;
def ResistanceSlope = (GetValue(PH, ResistanceFinishOffset) - GetValue(PH, ResistanceStartOffset)) / (PHBar - priorPHBar);
def SupportFinishOffset = if isFinalTwoLowPivots then currentBar - PLBar else 0;
def SupportStartOffset = if isFinalTwoLowPivots then currentBar - priorPLBar else 0;
def SupportSlope = (GetValue(PL, SupportFinishOffset) - GetValue(PL, SupportStartOffset)) / (PLBar - priorPLBar);
rec ResistanceExtend = if currentBar == HighestAll(PHBar) then 1 else ResistanceExtend[1];
rec SupportExtend = if currentBar == HighestAll(PLBar) then 1 else SupportExtend[1];
def pivotHigh = if
#isFinalTwoHighPivots
ph>0 then PH else Double.NaN;
def pivotLow = if
#isFinalTwoLowPivots
pl>0 then PL else Double.NaN;
plot PivotDot = if !IsNaN(pivotHigh) then pivotHigh else if !IsNaN(pivotLow) then pivotLow else Double.NaN;
PivotDot.SetDefaultColor(COLOR.YELLOW);
PivotDot.SetPaintingStrategy(PaintingStrategy.POINTS);
PivotDot.SetLineWeight(5);
Edited 2 time(s). Last edit at 05/11/2018 09:15PM by EARNINGS TRADER.
[imgur.com]
These are pivot areas. I want to auto draw a trendline to connect the last two dots of the lower high (red arrows) and a trendline to connect the last two higher low dots (green arrows) as in figure 2. I would like for these lines to be displayed until the next lower high or higher lows are formed. Any help is much appreciated
[imgur.com]
input numBars = 5;
input showLines = yes;
input showValues = yes;
input showBarNumbers = no;
input TrendResistanceStart = 0;
input TrendResistanceEnd = 0;
input TrendSupportStart = 0;
input TrendSupportEnd = 0;
def UserSetResistance = TrendResistanceStart > 0 and TrendResistanceEnd > 0;
def UserSetSupport = TrendSupportStart > 0 and TrendSupportEnd > 0;
def currentHigh = high;
def currentLow = low;
def currentBar = BarNumber();
def PH;
def PL;
def isHigherThanNextBars = fold i = 1 to numBars + 1 with p = 1
while p do currentHigh > GetValue(high, -i);
PH = if UserSetResistance and ( currentBar == TrendResistanceStart or currentBar == TrendResistanceEnd ) then currentHigh else if !UserSetResistance and (currentBar > numBars and currentHigh == Highest(currentHigh, numBars) and isHigherThanNextBars) then currentHigh else Double.NaN;
def isLowerThanNextBars = fold j = 1 to numBars + 1 with q = 1
while q do currentLow < GetValue(low, -j);
PL = if UserSetSupport and ( currentBar == TrendSupportStart or currentBar == TrendSupportEnd ) then currentLow else if !UserSetSupport and (currentBar > numBars and currentLow == Lowest(currentLow, numBars) and isLowerThanNextBars) then currentLow else Double.NaN;
rec PHBar = if UserSetResistance then TrendResistanceEnd else if !IsNaN(PH) then currentBar else PHBar[1];
rec PLBar = if UserSetSupport then TrendSupportEnd else if !IsNaN(PL) then currentBar else PLBar[1];
rec PHL = if !IsNaN(PH) then PH else PHL[1];
rec priorPHBar = if UserSetResistance then TrendResistanceStart else if PHL != PHL[1] then PHBar[1] else priorPHBar[1];
rec PLL = if !IsNaN(PL) then PL else PLL[1];
rec priorPLBar = if UserSetSupport then TrendSupportStart else if PLL != PLL[1] then PLBar[1] else priorPLBar[1];
def isFinalTwoHighPivots = currentBar >= HighestAll(priorPHBar);
def isFinalTwoLowPivots = currentBar >= HighestAll(priorPLBar);
def ResistanceFinishOffset = if isFinalTwoHighPivots then currentBar - PHBar else 0;
def ResistanceStartOffset = if isFinalTwoHighPivots then currentBar - priorPHBar else 0;
def ResistanceSlope = (GetValue(PH, ResistanceFinishOffset) - GetValue(PH, ResistanceStartOffset)) / (PHBar - priorPHBar);
def SupportFinishOffset = if isFinalTwoLowPivots then currentBar - PLBar else 0;
def SupportStartOffset = if isFinalTwoLowPivots then currentBar - priorPLBar else 0;
def SupportSlope = (GetValue(PL, SupportFinishOffset) - GetValue(PL, SupportStartOffset)) / (PLBar - priorPLBar);
rec ResistanceExtend = if currentBar == HighestAll(PHBar) then 1 else ResistanceExtend[1];
rec SupportExtend = if currentBar == HighestAll(PLBar) then 1 else SupportExtend[1];
def pivotHigh = if
#isFinalTwoHighPivots
ph>0 then PH else Double.NaN;
def pivotLow = if
#isFinalTwoLowPivots
pl>0 then PL else Double.NaN;
plot PivotDot = if !IsNaN(pivotHigh) then pivotHigh else if !IsNaN(pivotLow) then pivotLow else Double.NaN;
PivotDot.SetDefaultColor(COLOR.YELLOW);
PivotDot.SetPaintingStrategy(PaintingStrategy.POINTS);
PivotDot.SetLineWeight(5);
Edited 2 time(s). Last edit at 05/11/2018 09:15PM by EARNINGS TRADER.
|
Re: Need Scripting Help May 14, 2018 04:06AM |
Registered: 7 years ago Posts: 126 |
|
Re: Need Scripting Help May 14, 2018 12:13PM |
Registered: 6 years ago Posts: 33 |
RIGEL, this is the study i end up with, thank you for your help..
#MTF_ADX_METER
#created by m0biledev@yahoo.com
#DECLARE LOWER;
#############################
input length = 9; #14
input ADX_length = 14;
input ShowADXValue = {DoNotShow, OnLeft, default OnRight};
input DisplayStrengthMeter = {"No", default "Yes"};
#@@@
def agg = close;
def data = close(period = agg);
def agg_5 = AggregationPeriod.FIVE_MIN;
def data_5 = close(period = agg_5);
def agg_10 = AggregationPeriod.TEN_MIN;
def data_10 = close(period = agg_10);
def hiDiff = high(period = agg) - high(period = agg)[1];
def loDiff = low(period = agg)[1] - low(period = agg);
def plusDM = if hiDiff > loDiff and hiDiff > 0 then hiDiff else 0;
def minusDM = if loDiff > hiDiff and loDiff > 0 then loDiff else 0;
def ATR = WildersAverage(TrueRange(high(period = agg), close(period = agg), low(period = agg)), ADX_length);
def "DI+" = 100 * WildersAverage(plusDM, ADX_length) / ATR;
def "DI-" = 100 * WildersAverage(minusDM, ADX_length) / ATR;
def DX = if ("DI+" + "DI-" > 0) then 100 * AbsValue("DI+" - "DI-" ) / ("DI+" + "DI-" ) else 0;
##@@@@@@@@@@@@@@@@@@@
def hiDiff_5 = high(period = agg_5) - high(period = agg_5)[1];
def loDiff_5 = low(period = agg_5)[1] - low(period = agg_5);
def plusDM_5 = if hiDiff_5 > loDiff_5 and hiDiff_5 > 0 then hiDiff_5 else 0;
def minusDM_5 = if loDiff_5 > hiDiff_5 and loDiff_5 > 0 then loDiff_5 else 0;
def ATR_5 = WildersAverage(TrueRange(high(period = agg_5), close(period = agg_5), low(period = agg_5)), ADX_length);
def "DI+5" = 100 * WildersAverage(plusDM_5, ADX_length) / ATR_5;
def "DI-5" = 100 * WildersAverage(minusDM_5, ADX_length) / ATR_5;
def DX_5 = if ("DI+5" + "DI-5" > 0) then 100 * AbsValue("DI+5" - "DI-5" ) / ("DI+5" + "DI-5" ) else 0;
##@@@@@@@@@@@@@@@@@@@@
def hiDiff_10 = high(period = agg_10) - high(period = agg_10)[1];
def loDiff_10 = low(period = agg_10)[1] - low(period = agg_10);
def plusDM_10 = if hiDiff_10 > loDiff_10 and hiDiff_10 > 0 then hiDiff_10 else 0;
def minusDM_10 = if loDiff_10 > hiDiff_10 and loDiff_10 > 0 then loDiff_10 else 0;
def ATR_10 = WildersAverage(TrueRange(high(period = agg_10), close(period = agg_10), low(period = agg_10)), ADX_length);
def "DI+10" = 100 * WildersAverage(plusDM_10, ADX_length) / ATR_10;
def "DI-10" = 100 * WildersAverage(minusDM_10, ADX_length) / ATR_10;
def DX_10 = if ("DI+10" + "DI-10" > 0) then 100 * AbsValue("DI+10" - "DI-10" ) / ("DI+10" + "DI-10" ) else 0;
#@@@@@@@@@@@@@@@@@@@@@@@@@@@@@@@@@@@
#######def ADX = DMI(length).ADX;
def DIBull = DIPlus(ADX_length);
def DIBear = DIMinus(ADX_length);
DEF BullishTrend = DIBull >= DIBear ;
#METER######################################
input LookBack6 = 6;#6
input LookBack5 = 2;#5
input LookBack3 = 3;#3
input FixedValueBkgndColor = {default "No", "Yes"};
def ADX6 = DMI(LookBack6);#.ADX
def ADX3 = DMI(LookBack3);#.ADX
def ADX1 = DMI(LookBack5);#.ADX
def ADX_6 = WildersAverage(DX, LookBack6);
def ADX_3 = WildersAverage(DX, LookBack5);
def ADX_1 = WildersAverage(DX, LookBack5);
def ADX6_5 = WildersAverage(DX_5, LookBack6);
def ADX3_5 = WildersAverage(DX_5, LookBack5);
def ADX1_5 = WildersAverage(DX_5, LookBack5);
def ADX6_10 = WildersAverage(DX_10, LookBack6);
def ADX3_10 = WildersAverage(DX_10, LookBack5);
def ADX1_10 = WildersAverage(DX_10, LookBack5);
def ShowDigits;
switch (ShowADXValue)
{
case DoNotShow:
ShowDigits = 0;
case OnLeft:
ShowDigits = 1;
case OnRight:
ShowDigits = 2;
}
def HighlightColor =
if (ADX1 >= 50) then 51 else
if (ADX1 >= 40 and ADX1 < 50) then 51 else
if (ADX1 >= 30 and ADX1 < 40) then 102 else
if (ADX1 >= 20 and ADX1 < 30) then 153 else
if (ADX1 >= 10 and ADX1 < 20) then 204 else
255;
def HighlightColor_5 =
if (ADX1_5 >= 50) then 51 else
if (ADX1_5 >= 40 and ADX1_5 < 50) then 51 else
if (ADX1_5 >= 30 and ADX1_5 < 40) then 102 else
if (ADX1_5 >= 20 and ADX1_5 < 30) then 153 else
if (ADX1_5 >= 10 and ADX1_5 < 20) then 204 else
255;
def HighlightColor_10 =
if (ADX1_10 >= 50) then 51 else
if (ADX1_10 >= 40 and ADX1_10 < 50) then 51 else
if (ADX1_10 >= 30 and ADX1_10 < 40) then 102 else
if (ADX1_10 >= 20 and ADX1_10 < 30) then 153 else
if (ADX1_10 >= 10 and ADX1_10 < 20) then 204 else
255;
def ADXBkgndValueR = 55;#25
def ADXBkgndValueG = 55;#25
def ADXBkgndValueB = 55;#25
#@@
AddLabel (yes, "MTF_METER", Color.WHITE);
#AddLabel (yes, "/", Color.WHITE);
#AddLabel( ShowDigits == 2, Floor(ADX_6) - FLOOR(ADX_1) - Floor(ADX_3), CreateColor(if !BullishTrend then 255 else HighlightColor, if !BullishTrend then HighlightColor else 255 , 51));
#@@
#AddLabel (yes, "MTF_METER", Color.WHITE);
#AddLabel (yes, "/", Color.WHITE);
AddLabel( ShowDigits == 2, Floor(ADX6) - FLOOR(ADX1) - Floor(ADX3), CreateColor(if !BullishTrend then 255 else HighlightColor, if !BullishTrend then HighlightColor else 255 , 51));
AddLabel (yes, "/", Color.WHITE);
AddLabel( ShowDigits == 2, Floor(ADX6_5) - FLOOR(ADX1_5) - Floor(ADX3_5), CreateColor(if !BullishTrend then 255 else HighlightColor_5, if !BullishTrend then HighlightColor_5 else 255 , 51));
#AddLabel (yes, "/", Color.WHITE);
#AddLabel( ShowDigits == 2, Floor(ADX6_10) - FLOOR(ADX1_10) - Floor(ADX3_10), CreateColor(if !BullishTrend then 255 else HighlightColor_10, if !BullishTrend then HighlightColor_10 else 255 , 51));
##AddLabel (yes, "/", Color.WHITE);
AddLabel( ShowDigits == 2, Floor(ADX6) - FLOOR(ADX1) - Floor(ADX3) - Floor(ADX6_5) - FLOOR(ADX1_5) - Floor(ADX3_5) - Floor(ADX6_10) - FLOOR(ADX1_10) - Floor(ADX3_10), CreateColor(if !BullishTrend then 255 else HighlightColor_10, if !BullishTrend then HighlightColor_10 else 255 , 51));
#end code
##@@@@@@@@@@@@@@@@@@@@@@
|
AddCloud on Tick Chart. multiple time frame analysis on tick chart May 14, 2018 09:49AM |
Registered: 5 years ago Posts: 7 |
Hi Robert,
I have two Charts.
-Chart #1 –1536 Tick Candle Chart. (Chart Type – Candle and Aggregation Type Tick)
-Chart #2 – 512 Tick Candle Chart. (Chart Type – Candle and Aggregation Type Tick)
As you know right after three different 512 Tick Candle Chat have formed; than 1536 Tick Candle Chart forms.
Can we program (thinkorswim Script) so that once three 512 tick candle Charts have formed I want to overlay the
on Chart #2. (Basically overlay 2 time frames Tick Candle Chart on same chart)
I also got respond from thinkScript@thinkorswim.com
It is not possible to specifically reference tick data with thinkScript, so you would need to take the approach of looking at it in terms of bar numbers. You would need to use the barNumber to check groups of three bars on a 512-tick chart, then calculate the corresponding 1536-tick values, and then use AddCloud to highlight the areas you want highlighted.
Please help me.
Thank you for help.
Paras
|
Re: AddCloud on Tick Chart. multiple time frame analysis on tick chart May 14, 2018 10:51AM |
Registered: 5 years ago Posts: 7 |
|
Re: Need Scripting Help May 15, 2018 04:43AM |
Registered: 7 years ago Posts: 126 |
Mobile
Thanks for posting. Your code has many lines not used therefore the performance of your script will not be optimal.
Not sure what you try to achieve. What does the meter indicate?
Below is a cleaned version of your code. Notice that your switch statement can be re-written because your labels are show only when user selects Right (==2), so no need to make a switch.
Edited 1 time(s). Last edit at 05/15/2018 04:47AM by rigel.
Thanks for posting. Your code has many lines not used therefore the performance of your script will not be optimal.
Not sure what you try to achieve. What does the meter indicate?
Below is a cleaned version of your code. Notice that your switch statement can be re-written because your labels are show only when user selects Right (==2), so no need to make a switch.
#MTF_ADX_METER
#created by m0biledev@yahoo.com
#DECLARE LOWER;


#############################
input length = 9; #14
input ADX_length = 14;
input ShowADXValue = {DoNotShow, OnLeft, default OnRight};
input DisplayStrengthMeter = {"No", default "Yes"};
#input FixedValueBkgndColor = {default "No", "Yes"}; #Not used in your code
# for  ADX
input LookBack6 = 6;#6
input LookBack5 = 2;#5
input LookBack3 = 3;#3


# aggregation periods used
def agg_5 = AggregationPeriod.FIVE_MIN;
def agg_10 = AggregationPeriod.TEN_MIN;


def hiDiff_5 = high(period = agg_5) - high(period = agg_5)[1];
def loDiff_5 = low(period = agg_5)[1] - low(period = agg_5);

def plusDM_5 = if hiDiff_5 > loDiff_5 and hiDiff_5 > 0 then hiDiff_5 else 0;
def minusDM_5 = if loDiff_5 > hiDiff_5 and loDiff_5 > 0 then loDiff_5 else 0;

def ATR_5 = WildersAverage(TrueRange(high(period = agg_5), close(period = agg_5), low(period = agg_5)), ADX_length);
def "DI+5" = 100 * WildersAverage(plusDM_5, ADX_length) / ATR_5;
def "DI-5" = 100 * WildersAverage(minusDM_5, ADX_length) / ATR_5;

def DX_5 = if ("DI+5" + "DI-5" > 0) then 100 * AbsValue("DI+5" - "DI-5" ) / ("DI+5" + "DI-5" ) else 0;

##@@@@@@@@@@@@@@@@@@@@

def hiDiff_10 = high(period = agg_10) - high(period = agg_10)[1];
def loDiff_10 = low(period = agg_10)[1] - low(period = agg_10);

def plusDM_10 = if hiDiff_10 > loDiff_10 and hiDiff_10 > 0 then hiDiff_10 else 0;
def minusDM_10 = if loDiff_10 > hiDiff_10 and loDiff_10 > 0 then loDiff_10 else 0;

def ATR_10 = WildersAverage(TrueRange(high(period = agg_10), close(period = agg_10), low(period = agg_10)), ADX_length);
def "DI+10" = 100 * WildersAverage(plusDM_10, ADX_length) / ATR_10;
def "DI-10" = 100 * WildersAverage(minusDM_10, ADX_length) / ATR_10;

def DX_10 = if ("DI+10" + "DI-10" > 0) then 100 * AbsValue("DI+10" - "DI-10" ) / ("DI+10" + "DI-10" ) else 0;

#@@@@@@@@@@@@@@@@@@@@@@@@@@@@@@@@@@@

#######def ADX = DMI(length).ADX;
def DIBull = DIPlus(ADX_length);
def DIBear = DIMinus(ADX_length);

DEF BullishTrend = DIBull >= DIBear ;


#METER######################################


def ADX6 = DMI(LookBack6);#.ADX
def ADX3 = DMI(LookBack3);#.ADX
def ADX1 = DMI(LookBack5);#.ADX

def ADX6_5 = WildersAverage(DX_5, LookBack6);
def ADX3_5 = WildersAverage(DX_5, LookBack5);
def ADX1_5 = WildersAverage(DX_5, LookBack5);
def ADX6_10 = WildersAverage(DX_10, LookBack6);
def ADX3_10 = WildersAverage(DX_10, LookBack5);
def ADX1_10 = WildersAverage(DX_10, LookBack5);

############################ This section can be replaced/improved
def ShowDigits;

switch (ShowADXValue)
{
case DoNotShow:
    ShowDigits = 0;
case OnLeft:
    ShowDigits = 1;
case OnRight:
    ShowDigits = 2;
}
########################################################################

def HighlightColor =
if (ADX1 >= 50) then 51 else
    if (ADX1 >= 40 and ADX1 < 50) then 51 else
        if (ADX1 >= 30 and ADX1 < 40) then 102 else
            if (ADX1 >= 20 and ADX1 < 30) then 153 else
                if (ADX1 >= 10 and ADX1 < 20) then 204 else
255;


def HighlightColor_5 =
if (ADX1_5 >= 50) then 51 else
    if (ADX1_5 >= 40 and ADX1_5 < 50) then 51 else
        if (ADX1_5 >= 30 and ADX1_5 < 40) then 102 else
            if (ADX1_5 >= 20 and ADX1_5 < 30) then 153 else
                if (ADX1_5 >= 10 and ADX1_5 < 20) then 204 else
255;

def HighlightColor_10 =
if (ADX1_10 >= 50) then 51 else
    if (ADX1_10 >= 40 and ADX1_10 < 50) then 51 else
        if (ADX1_10 >= 30 and ADX1_10 < 40) then 102 else
            if (ADX1_10 >= 20 and ADX1_10 < 30) then 153 else
                if (ADX1_10 >= 10 and ADX1_10 < 20) then 204 else
255;

#-------------------------------------------------  Results ---------------------------------------------------------------------
#@@
AddLabel (yes, "MTF_METER", Color.WHITE);
#AddLabel (yes, "/", Color.WHITE);
#AddLabel( ShowDigits == 2, Floor(ADX_6) - FLOOR(ADX_1) - Floor(ADX_3), CreateColor(if !BullishTrend then 255 else HighlightColor, if !BullishTrend then HighlightColor else 255 , 51));

#@@
#AddLabel (yes, "MTF_METER", Color.WHITE);
#AddLabel (yes, "/", Color.WHITE);
AddLabel( ShowDigits == 2, Floor(ADX6) - FLOOR(ADX1) - Floor(ADX3), CreateColor(if !BullishTrend then 255 else HighlightColor, if !BullishTrend then HighlightColor else 255 , 51));
AddLabel (yes, "/", Color.WHITE);

AddLabel( ShowDigits == 2, Floor(ADX6_5) - FLOOR(ADX1_5) - Floor(ADX3_5), CreateColor(if !BullishTrend then 255 else HighlightColor_5, if !BullishTrend then HighlightColor_5 else 255 , 51));

#AddLabel (yes, "/", Color.WHITE);

#AddLabel( ShowDigits == 2, Floor(ADX6_10) - FLOOR(ADX1_10) - Floor(ADX3_10), CreateColor(if !BullishTrend then 255 else HighlightColor_10, if !BullishTrend then HighlightColor_10 else 255 , 51));

##AddLabel (yes, "/", Color.WHITE);
AddLabel( ShowDigits == 2, Floor(ADX6) - FLOOR(ADX1) - Floor(ADX3) - Floor(ADX6_5) - FLOOR(ADX1_5) - Floor(ADX3_5) - Floor(ADX6_10) - FLOOR(ADX1_10) - Floor(ADX3_10), CreateColor(if !BullishTrend then 255 else HighlightColor_10, if !BullishTrend then HighlightColor_10 else 255 , 51));

#end code
Edited 1 time(s). Last edit at 05/15/2018 04:47AM by rigel.
|
Re: Need Scripting Help May 15, 2018 09:12AM |
Registered: 6 years ago Posts: 33 |
|
Re: AddCloud on Tick Chart. multiple time frame analysis on tick chart May 16, 2018 10:02AM |
Registered: 7 years ago Posts: 126 |
|
Re: Fun with ThinkScript May 16, 2018 04:59PM |
Registered: 6 years ago Posts: 33 |
HI, ANY one who would help...
some how the ploted squares only displays the green positive and not the red negative.
How can it be?
input lengthFORCE = 13;
PLOT FI = ExpAverage(data = (close - close[1]) *volume, lengthFORCE);
plot F_I = if FI >= 0 then -25 else Double.NaN;
F_I.SetPaintingStrategy (PaintingStrategy.SQUARES);
F_I.SetLineWeight (3);
F_I.AssignValueColor(if FI> 0 then Color.GREEN else if FI< 0 then Color.YELLOW else Color.LIGHT_GRAY);
|
Help with coding? May 16, 2018 06:22PM |
Registered: 5 years ago Posts: 1 |
Hi,
So I was wanting to create a study that would auto generate .25 increment plot lines.
As the bar crosses over or under the plot line, the line color should change.
Would be cool to be able to have it start at market open and end at market close, save then reset every market day. Repeat. But I wasn't able to find anything that I could understand and actually incorporate into the barbaric / generic code I pieced together. Lol.
Also would be nice to make it more compact. There's a lot of repetition.
I don't know anything about coding so I just pieced things together and the below is what made sense.
input MyLevel = 272;
input One = .25;
input Two = .50;
input Three = .75;
input Four = 1;
input Five = 1.25;
input Six = 1.50;
input Seven = 1.75;
input Eight = 2;
input Nine = 2.25;
input Ten = 2.50;
input NegOne = .25;
input NegTwo = .50;
input NegThree = .75;
input NegFour = 1;
input NegFive = 1.25;
input NegSix = 1.50;
input NegSeven = 1.75;
input NegEight = 2;
input NegNine = 2.25;
input NegTen = 2.50;
plot Level = MyLevel;
Level.AssignValueColor(if close>=Level then Color.Pink else Color. Yellow);
Level.AssignValueColor(if close<=Level then Color.Yellow else Color.Pink);
Level.SetStyle(curve.MEDIUM_DASH);
Level.SetLineWeight(1);
plot OneLevel = MyLevel + One;
OneLevel.AssignValueColor(if close>=OneLevel then Color.Pink else Color.Cyan);
OneLevel.AssignValueColor(if close<=OneLevel then Color.Cyan else Color.Pink);
OneLevel.SetStyle(curve.MEDIUM_DASH);
OneLevel.SetLineWeight(1);
plot TwoLevel = MyLevel + Two;
TwoLevel.AssignValueColor(if close>=TwoLevel then Color.Pink else Color.Cyan);
TwoLevel.AssignValueColor(if close<=TwoLevel then Color.Cyan else Color.Pink);
TwoLevel.SetStyle(curve.MEDIUM_DASH);
TwoLevel.SetLineWeight(1);
plot ThreeLevel = MyLevel + Three;
ThreeLevel.AssignValueColor(if close>=ThreeLevel then Color.Pink else Color.Cyan);
ThreeLevel.AssignValueColor(if close<=ThreeLevel then Color.Cyan else Color.Pink);
ThreeLevel.SetStyle(curve.MEDIUM_DASH);
ThreeLevel.SetLineWeight(1);
plot FourLevel = MyLevel + Four;
FourLevel.AssignValueColor(if close>=FourLevel then Color.Pink else Color.Cyan);
FourLevel.AssignValueColor(if close<=FourLevel then Color.Cyan else Color.Pink);
FourLevel.SetStyle(curve.MEDIUM_DASH);
FourLevel.SetLineWeight(1);
plot FiveLevel = MyLevel + Five;
FiveLevel.AssignValueColor(if close>=FiveLevel then Color.Pink else Color.Cyan);
FiveLevel.AssignValueColor(if close<=FiveLevel then Color.Cyan else Color.Pink);
FiveLevel.SetStyle(curve.MEDIUM_DASH);
FiveLevel.SetLineWeight(1);
plot SixLevel = MyLevel + Six;
SixLevel.AssignValueColor(if close>=SixLevel then Color.Pink else Color.Cyan);
SixLevel.AssignValueColor(if close<=SixLevel then Color.Cyan else Color.Pink);
SixLevel.SetStyle(curve.MEDIUM_DASH);
SixLevel.SetLineWeight(1);
plot SevenLevel = MyLevel + Seven;
SevenLevel.AssignValueColor(if close>=SevenLevel then Color.Pink else Color.Cyan);
SevenLevel.AssignValueColor(if close<=SevenLevel then Color.Cyan else Color.Pink);
SevenLevel.SetStyle(curve.MEDIUM_DASH);
SevenLevel.SetLineWeight(1);
plot EightLevel = MyLevel + Eight;
EightLevel.AssignValueColor(if close>=EightLevel then Color.Pink else Color.Cyan);
EightLevel.AssignValueColor(if close<=EightLevel then Color.Cyan else Color.Pink);
EightLevel.SetStyle(curve.MEDIUM_DASH);
EightLevel.SetLineWeight(1);
plot NineLevel = MyLevel + Nine;
NineLevel.AssignValueColor(if close>=NineLevel then Color.Pink else Color.Cyan);
NineLevel.AssignValueColor(if close<=NineLevel then Color.Cyan else Color.Pink);
NineLevel.SetStyle(curve.MEDIUM_DASH);
NineLevel.SetLineWeight(1);
plot TenLevel = MyLevel + Ten;
TenLevel.AssignValueColor(if close>=TenLevel then Color.Pink else Color.Cyan);
TenLevel.AssignValueColor(if close<=TenLevel then Color.Cyan else Color.Pink);
TenLevel.SetStyle(curve.MEDIUM_DASH);
TenLevel.SetLineWeight(1);
plot NegOneLevel = MyLevel - NegOne;
NegOneLevel.AssignValueColor(if close<=NegOneLevel then Color.Pink else Color.Cyan);
NegOneLevel.AssignValueColor(if close>=NegOneLevel then Color.Cyan else Color.Pink);
NegOneLevel.SetStyle(curve.MEDIUM_DASH);
NegOneLevel.SetLineWeight(1);
plot NegTwoLevel = MyLevel - NegTwo;
NegTwoLevel.AssignValueColor(if close<=NegTwoLevel then Color.Pink else Color.Cyan);
NegTwoLevel.AssignValueColor(if close>=NegTwoLevel then Color.Cyan else Color.Pink);
NegTwoLevel.SetStyle(curve.MEDIUM_DASH);
NegTwoLevel.SetLineWeight(1);
plot NegThreeLevel = MyLevel - NegThree;
NegThreeLevel.AssignValueColor(if close<=NegThreeLevel then Color.Pink else Color.Cyan);
NegThreeLevel.AssignValueColor(if close>=NegThreeLevel then Color.Cyan else Color.Pink);
NegThreeLevel.SetStyle(curve.MEDIUM_DASH);
NegThreeLevel.SetLineWeight(1);
plot NegFourLevel = MyLevel - NegFour;
NegFourLevel.AssignValueColor(if close<=NegFourLevel then Color.Pink else Color.Cyan);
NegFourLevel.AssignValueColor(if close>=NegFourLevel then Color.Cyan else Color.Pink);
NegFourLevel.SetStyle(curve.MEDIUM_DASH);
NegFourLevel.SetLineWeight(1);
plot NegFiveLevel = MyLevel - NegFive;
NegFiveLevel.AssignValueColor(if close<=NegFiveLevel then Color.Pink else Color.Cyan);
NegFiveLevel.AssignValueColor(if close>=NegFiveLevel then Color.Cyan else Color.Pink);
NegFiveLevel.SetStyle(curve.MEDIUM_DASH);
NegFiveLevel.SetLineWeight(1);
plot NegSixLevel = MyLevel - NegSix;
NegSixLevel.AssignValueColor(if close<=NegSixLevel then Color.Pink else Color.Cyan);
NegSixLevel.AssignValueColor(if close>=NegSixLevel then Color.Cyan else Color.Pink);
NegSixLevel.SetStyle(curve.MEDIUM_DASH);
NegSixLevel.SetLineWeight(1);
plot NegSevenLevel = MyLevel - NegSeven;
NegSevenLevel.AssignValueColor(if close<=NegSevenLevel then Color.Pink else Color.Cyan);
NegSevenLevel.AssignValueColor(if close>=NegSevenLevel then Color.Cyan else Color.Pink);
NegSevenLevel.SetStyle(curve.MEDIUM_DASH);
NegSevenLevel.SetLineWeight(1);
plot NegEightLevel = MyLevel - NegEight;
NegEightLevel.AssignValueColor(if close<=NegEightLevel then Color.Pink else Color.Cyan);
NegEightLevel.AssignValueColor(if close>=NegEightLevel then Color.Cyan else Color.Pink);
NegEightLevel.SetStyle(curve.MEDIUM_DASH);
NegEightLevel.SetLineWeight(1);
plot NegNineLevel = MyLevel - NegNine;
NegNineLevel.AssignValueColor(if close<=NegNineLevel then Color.Pink else Color.Cyan);
NegNineLevel.AssignValueColor(if close>=NegNineLevel then Color.Cyan else Color.Pink);
NegNineLevel.SetStyle(curve.MEDIUM_DASH);
NegNineLevel.SetLineWeight(1);
plot NegTenLevel = MyLevel - NegTen;
NegTenLevel.AssignValueColor(if close<=NegTenLevel then Color.Pink else Color.Cyan);
NegTenLevel.AssignValueColor(if close>=NegTenLevel then Color.Cyan else Color.Pink);
NegTenLevel.SetStyle(curve.MEDIUM_DASH);
NegTenLevel.SetLineWeight(1);
Any help w/ simplifying and fine tuning it would be greatly appreciated.
Would also like to know what each tweaked piece translated to so I could possibly understand coding a little better.
Thank you!
|
Re: AddCloud on Tick Chart. multiple time frame analysis on tick chart May 17, 2018 10:48AM |
Registered: 5 years ago Posts: 7 |
Hi Rigel,
Thank you for your reply.
Is that possible that addcloud on 3 tick candle chart (512 tick each chart) opening price and closing price ( not the opening high and closing high price) based on to 1536 tick candle chart opening price and closing price.
I really appreciate for your help.
Regards,
Paras
Thank you for your reply.
Is that possible that addcloud on 3 tick candle chart (512 tick each chart) opening price and closing price ( not the opening high and closing high price) based on to 1536 tick candle chart opening price and closing price.
I really appreciate for your help.
Regards,
Paras
|
Re: Fun with ThinkScript May 18, 2018 06:25AM |
Registered: 7 years ago Posts: 126 |
Mobile
your code has conflicting instructions.
This will plot very high numbers in the same scale of the stock chart...
Edited 1 time(s). Last edit at 05/18/2018 06:54AM by rigel.
your code has conflicting instructions.
This will plot very high numbers in the same scale of the stock chart...
PLOT FI = ExpAverage((close - close[1]) *volume, lengthFORCE);and then, you are asking to plot negative values (-25) but only when FI is positive.... Do you notice that any color statement for FI negative values will never be executed?
plot F_I = if FI >= 0 then -25 else Double.NaN;
Edited 1 time(s). Last edit at 05/18/2018 06:54AM by rigel.
|
Re: Help with coding? May 18, 2018 06:52AM |
Registered: 7 years ago Posts: 126 |
Let's try to clarify your wishes
Don't see the point of doing that, your base value is 272 every single day, so all the lines will be in the same position every day regardless of market time. What does it mean save and reset in that context?
In your code, you can eliminate the second assignment because you are repeating yourself
In the second: color yellow when close below or equal to Level (which you already considered in first) and color pink any other case (that is when is above, considered also in first)
Actually you are giving conflicting instruction when is equal to level one, in first you say pink and in second you say yellow.
So probably you only need this statement (also for the other lines):
Level.AssignValueColor(if close>=Level then Color.Pink else Color. Yellow); (equal case will be pink)
or
Level.AssignValueColor(if close>Level then Color.Pink else Color. Yellow); (equal case will be yellow)
Quote
GoldenPineapple
Would be cool to be able to have it start at market open and end at market close, save then reset every market day. Repeat.
Don't see the point of doing that, your base value is 272 every single day, so all the lines will be in the same position every day regardless of market time. What does it mean save and reset in that context?
In your code, you can eliminate the second assignment because you are repeating yourself
Level.AssignValueColor(if close>=Level then Color.Pink else Color. Yellow); Level.AssignValueColor(if close<=Level then Color.Yellow else Color.Pink);In the first you are saying: color pink when the close is above or equal to Level any other case should be color yellow.
In the second: color yellow when close below or equal to Level (which you already considered in first) and color pink any other case (that is when is above, considered also in first)
Actually you are giving conflicting instruction when is equal to level one, in first you say pink and in second you say yellow.
So probably you only need this statement (also for the other lines):
Level.AssignValueColor(if close>=Level then Color.Pink else Color. Yellow); (equal case will be pink)
or
Level.AssignValueColor(if close>Level then Color.Pink else Color. Yellow); (equal case will be yellow)
|
Re: AddCloud on Tick Chart. multiple time frame analysis on tick chart May 18, 2018 03:47PM |
Registered: 7 years ago Posts: 126 |
Paras
Was playing a bit with the charts and while it is very easy to do and aggregation as you require, at the end you will need to plot the candles (overlay) and that is where TOS does not help anymore.
To do the plot it would be necessary to use the function addchart that was deprecated as explained by Robert here
Not only is a problem of colors but more importantly to cover 3 candlestick (in 512 t) with a big one (1636 t) is not something that could be done with that function in my opinion.
|
Re: AddCloud on Tick Chart. multiple time frame analysis on tick chart May 18, 2018 09:28PM |
Registered: 6 years ago Posts: 6 |
addchart is working fine with colors. it is not deprecated in any way.
natively drawn bars on TOS are nothing compared to using the addchart function.
just because TOS does not provide support does not mean it doesn't work. TOS folks don't know their A*S from their elbow....so what's new.
if you want to play social media games, then rely on TOS for that. if you want to trade, then program it yourself because they don't have a clue.
rigel Wrote:
-------------------------------------------------------
> Paras
>
> function addchart that was deprecated as explained
> by Robert here
>
|
Re: AddCloud on Tick Chart. multiple time frame analysis on tick chart May 19, 2018 04:13PM |
Registered: 5 years ago Posts: 7 |
Hi radingt.
Thank you for your reply.
I have found some thinkorswim script on line.
1. def x = if (1 + x[1])==6 then 0 else 1 + x[1];
addverticalLine(x==0);
It's add vertical line every 6 bar.
2. thinorswim script put color on each bar. please help me for thinkorswim script to color of one bar (1536 ticks) on three bars (512)
this is the script I found on line.
# +--------------------------------------------------+
# | Example: Add Space Between Candles rev 2 |
# | Robert Payne |
# | rrpayne.blogspot.com |
# +--------------------------------------------------+
declare lower;
# hide the default candles
HidePricePlot();
# how many bars do you want between candles?
input BarsBetween = 1;
# calculate the offset
def lastBar = HighestAll(if !IsNaN(close) then BarNumber() else 0);
def offset = BarsBetween * ((lastBar - BarNumber()) / (BarsBetween + 1));
# build the candle
def o;
def h;
def l;
def c;
if offset % 1 == 0
then {
o = GetValue(open, -offset);
h = GetValue(high, -offset);
l = GetValue(low, -offset);
c = GetValue(close, -offset);
} else {
o = Double.NaN;
h = Double.NaN;
l = Double.NaN;
c = Double.NaN;
}
# just the UP candles
def UpO;
def UpH;
def UpL;
def UpC;
if o <= c
then {
UpO = o;
UpH = h;
UpL = l;
UpC = c;
} else {
UpO = Double.NaN;
UpH = Double.NaN;
UpL = Double.NaN;
UpC = Double.NaN;
}
# just the DOWN candles
def DnO;
def DnH;
def DnL;
def DnC;
if o > c
then {
DnO = o;
DnH = h;
DnL = l;
DnC = c;
} else {
DnO = Double.NaN;
DnH = Double.NaN;
DnL = Double.NaN;
DnC = Double.NaN;
}
# Plot the new Chart
# solid green (note that the open and close prices have been swapped
# to trick the function into filling in the candle bodies
AddChart(high = UpH, low = UpL, open = UpC, close = UpO, type = ChartType.CANDLE, growcolor = Color.UPTICK);
# solid red
AddChart(high = DnH, low = DnL, open = DnO, close = DnC, type = ChartType.CANDLE, growcolor = Color.DOWNTICK);
# outline green candles
AddChart(high = UpH, low = UpL, open = UpO, close = UpC, type = ChartType.CANDLE, growcolor = Color.BLACK);
# outline red candles
AddChart(high = DnH, low = DnL, open = DnC, close = DnO, type = ChartType.CANDLE, growcolor = Color.BLACK);
------------------------------------------------------------
Can we combine those above thinkscripts?
Thank you for help.
Regards,
Paras
|
Re: AddCloud on Tick Chart. multiple time frame analysis on tick chart May 21, 2018 08:17PM |
Registered: 5 years ago Posts: 7 |
Hi Rigel,
Is that possible combine 3 tick based bars and make 1 bar Tick based bar. (Like three 5 minutes candle chart = one 15 minutes candle Chart)
(( --def x = if (1 + x[1])==6 then 0 else 1 + x[1];
addverticalLine(x==0);
It's add vertical line every 6 bar. -- ))
Please give some advice If I could combine three tick based bars and make one tick based bar.
I really appreciate for your help.
Regards,
Paras
|
Re: AddCloud on Tick Chart. multiple time frame analysis on tick chart May 22, 2018 08:10AM |
Registered: 7 years ago Posts: 126 |
Quote
Paras
Is that possible combine 3 tick based bars and make 1 bar Tick based bar. (Like three 5 minutes candle chart = one 15 minutes candle Chart)
As explained before, the problem I see is to plot a big candle in the space occupied for 3 minor candles, in other words how to make a wide candle.
As far as I am aware, there is not a native function that can plot those candles.
What you want to do is done in other software packages and maybe you would need to buy the indicator, for example This one
Still, I think it is perfectly possible to do something similar to this
I meant colored areas representing the body of the big candle but missing the wicks. I believe that would take several hours coding though.
|
Re: Fun with ThinkScript May 22, 2018 12:28PM |
Registered: 8 years ago Posts: 15 |
Sorry,
Posted this wrong at first. Not a computer person.
As a non-coder I would like some help on what is probably easy for a coder-programmer?
But what I need is a lower indicator that plots green dots when say the 3 avg. is above 35 avg. of the DIA or any other symbol.
But this be plotted in the indicator window of another stock like say IBM.
So basicly what I am needing is:
When I have any stock chart open, I would like to be able to plot the above in the indicator window.
But the plot being of another market like an index or sector ETF etc. showing green if the 3 avg. is above the 35 avg.
How I explained this OK
Thanks,
|
Reference code? May 22, 2018 12:26PM |
Registered: 8 years ago Posts: 15 |
As a non-coder I would like some help on what is probably easy for a coder-programmer?
But what I need is a lower indicator that plots green dots when say the 3 avg. is above 35 avg. of the DIA or any other symbol.
But this be plotted in the indicator window of another stock like say IBM.
So basicly what I am needing is:
When I have any stock chart open, I would like to be able to plot the above in the indicator window.
But the plot being of another market like an index or sector ETF etc. showing green if the 3 avg. is above the 35 avg.
How I explained this OK
Thanks,
|
Re: Reference code? May 23, 2018 04:44AM |
Registered: 7 years ago Posts: 126 |
Styx
This code should do that

This code should do that
# Rigel, May 2018
#
declare lower;
input Sym2 = "SPY";

def c2 = close(symbol = Sym2);
def ma3=average(c2,3);
def ma35=average(c2,35);


plot Dots = (HighestAll(high) + LowestAll(low)) / 2;
Dots.SetStyle(Curve.POINTS);
Dots.SetLineWeight(5);
Dots.AssignValueColor(if ma3 > ma35 then Color.GREEN else Color.RED);
|
Re: AddCloud on Tick Chart. multiple time frame analysis on tick chart May 23, 2018 07:14AM |
Registered: 5 years ago Posts: 7 |
Hi Rigel,
Thank you for instantly reply. I was looking for something like that. 3 minor Candle bars combine to one major Candle bar. Your information is better (colored areas representing the body of the big candle but missing the wicks).
Please give me some ideas. Where can I get that kind of script and how much that script will cost?
Appreciate for your help.
Regards,
Paras


Sorry, only registered users may post in this forum.
Trade with Knowledge, Trade with Power - ResearchTrade.com.