Fun with ThinkScript
Posted by robert
|
Re: Using levels from EOD charts in intraday charts November 19, 2015 04:57AM |
Registered: 8 years ago Posts: 161 |
Okay, right-click on the study, EDIT STUDY, and for each plot under Draw As, the third choice in the dropdown looks to me like the silhouette of a submarine or something-- choose that and your vertical bars will render as transparent. If that's not enough contrast for you (lloks good to me), in addition you can change the bars' colors to paler shades. Glad it worked out. A lot of people don't even bother replying. Thanks.

EDIT: it just occurred to me you may be wanting to hard-code the Use Left Axis thing. Can't be done, not at present. A simple remedy is to "declare lower;" instead of upper and have the study in a separate lower panel. There may also be a (painful) workaround, though...
1. Write a lower study to display whatever combination of OHLC price you want as bars of dots or whatever.
2. Change the present study to "declare lower;".
3. Load both studies.
4. In your Edit Studies panel, when you hover over a loaded study you'll see triangular UP/DOWN arrows. Fiddle with them to merge the two studies into a single sub-panel. I think that would work.
Edited 1 time(s). Last edit at 11/19/2015 05:11AM by baffled1.
|
Re: Fun with ThinkScript November 19, 2015 07:45AM |
Registered: 10 years ago Posts: 464 |
|
Re: Fun with ThinkScript November 20, 2015 05:04PM |
Registered: 9 years ago Posts: 53 |
OK...Read back a few posts and saw that Robert is on a well deserved hiatus. In that case:
Can some help me with this if possible???
I've looked but can't find...
Can ThinkScript send a text message alert from the code?
For the code:
Alert(Cond1,GetSymbol() + " Near Support1", Alert.BAR, Sound.Chimes);
If possbile, where would the SMS text alert be?
Thanks
Can some help me with this if possible???
I've looked but can't find...
Can ThinkScript send a text message alert from the code?
For the code:
Alert(Cond1,GetSymbol() + " Near Support1", Alert.BAR, Sound.Chimes);
If possbile, where would the SMS text alert be?
Thanks
|
Re: Using levels from EOD charts in intraday charts November 22, 2015 04:56PM |
Registered: 8 years ago Posts: 61 |
|
Re: Using levels from EOD charts in intraday charts November 22, 2015 05:50PM |
Registered: 8 years ago Posts: 161 |
Tampman Wrote:
-------------------------------------------------------
> baffled - can you please post a pic of the chart
> so I can see what this is supposed to look like?
> Also, what time frames does this work on?
-------------------------------------------------------
Yeh, Tampman, using RichieRick's code from http://www.researchtrade.com/forum/read.php?7,2258,5785#msg-5785 and it really doesn't have many signals but those signals are typically very good, imo. It works for me on EURUSD H1 as a Red signal means the END of a downtrend and a Green signal means the END of an uptrend. Price reverses from these for at least 1 or 2 bars. For other timeframes I just study what happens. I messed with the "wiggle room" setting (changed it to 2 and more) to get more signals but lousy results. I will post a couple pics in a few minutes.
-------------------------------------------------------
> baffled - can you please post a pic of the chart
> so I can see what this is supposed to look like?
> Also, what time frames does this work on?
-------------------------------------------------------
Yeh, Tampman, using RichieRick's code from http://www.researchtrade.com/forum/read.php?7,2258,5785#msg-5785 and it really doesn't have many signals but those signals are typically very good, imo. It works for me on EURUSD H1 as a Red signal means the END of a downtrend and a Green signal means the END of an uptrend. Price reverses from these for at least 1 or 2 bars. For other timeframes I just study what happens. I messed with the "wiggle room" setting (changed it to 2 and more) to get more signals but lousy results. I will post a couple pics in a few minutes.
|
Re: Using levels from EOD charts in intraday charts November 22, 2015 06:13PM |
Registered: 8 years ago Posts: 161 |
|
Re: Using levels from EOD charts in intraday charts November 22, 2015 07:09PM |
Registered: 8 years ago Posts: 61 |
Thanks Baffled.. I put it into a lower study as I could not seem to get it to work on an upper study.. this is what it looks like.. seems to be correct... not sure how it works exactly (meaning what prompts the signal) or what time frames are best...but signals seem decent.. [s16.postimg.org] I agree signals can be far and few between.. maybe I am missing something but imho it seems best to use as a signal of the start of a trend up or down..not the end of it.. Also, as you can see on my chart I used a 1 setting for the Fat Pitch (narrow bar) and a 5 for a HR (wider bar).. although I'm not sure of the difference b/w the two.... Thanks for the reply!
Edited 5 time(s). Last edit at 11/22/2015 07:20PM by Tampman.
Edited 5 time(s). Last edit at 11/22/2015 07:20PM by Tampman.
|
Re: Using levels from EOD charts in intraday charts November 22, 2015 07:19PM |
Registered: 8 years ago Posts: 161 |
Tampman Wrote:
-------------------------------------------------------
> Thanks Baffled.. I put it into a lower study as I
> could not seem to get it to work on an upper
> study.. this is what it looks like.. seems to be
> correct... not sure how it works exactly (meaning
> what prompts the signal) or what time frames are
> best...but signals seem decent..
> [s16.postimg.org] Maybe
> I am missing something but imho it seems best to
> use as a signal of the start of a trend up or
> down..not the end of it.. Thanks for the reply!
==========================
Yep, gotcha. You're using a Daily chart and signals are different.
|
Re: Using levels from EOD charts in intraday charts November 22, 2015 07:24PM |
Registered: 8 years ago Posts: 61 |
Signals look the same to me on lower TF's too..ie., signals start of trend. I had to zoom out so you can see more than one.. here's 1hr and 15 min... [s4.postimg.org] and [s22.postimg.org]
Edited 1 time(s). Last edit at 11/22/2015 07:24PM by Tampman.
Edited 1 time(s). Last edit at 11/22/2015 07:24PM by Tampman.
|
Re: Using levels from EOD charts in intraday charts November 22, 2015 07:31PM |
Registered: 8 years ago Posts: 161 |
|
Re: Using levels from EOD charts in intraday charts November 22, 2015 07:31PM |
Registered: 8 years ago Posts: 61 |
Baffled - Here's a15 min of the EUR/USD... Blue bar = Up... Red bar = Down.. maybe you just had a false signal.. [s23.postimg.org] Anyway, looks promising..Good Luck buddy! And Thank You RickyRick for sharing this!
Edited 2 time(s). Last edit at 11/22/2015 07:33PM by Tampman.
Edited 2 time(s). Last edit at 11/22/2015 07:33PM by Tampman.
|
Re: Using levels from EOD charts in intraday charts November 22, 2015 08:06PM |
Registered: 8 years ago Posts: 161 |
Tampman Wrote:
-------------------------------------------------------
> Baffled - Here's a15 min of the EUR/USD... Blue
> bar = Up... Red bar = Down.. maybe you just had a
> false signal..
> [s23.postimg.org]
> Anyway, looks promising..Good Luck buddy! And
> Thank You RickyRick for sharing this!
===================
Tampman, it seems to vary according to timeframe, doesn't it? And maybe also according to security, /es vs eurusd, etc.
|
Re: Using levels from EOD charts in intraday charts November 22, 2015 08:11PM |
Registered: 8 years ago Posts: 61 |
|
Re: Using levels from EOD charts in intraday charts November 22, 2015 08:18PM |
Registered: 8 years ago Posts: 161 |
|
Re: Using levels from EOD charts in intraday charts November 25, 2015 04:20PM |
Registered: 8 years ago Posts: 161 |
 I'm seeing both, actually, on EURUSD H1. Hmmm... alright, time to try some of your settings. Will let ya know.
|
Re: Using levels from EOD charts in intraday charts November 25, 2015 04:37PM |
Registered: 8 years ago Posts: 161 |
Tampman, I tried your 1,5 settings on eurusdH1 and got more sigs but not good. Maybe only works on your timeframes? I "assume" you meant for me to change code itself, not use the default input from chart screen for "wiggle room"? There's only one "wiggle room" input is what I mean. So I changed code as follows:
plot FatPitchUp = crossingUpSum == 1;
plot HomeRunFatPitchUp = crossingUpSum == 5;
plot FatPitchDown = crossingDownSum == 1;
plot HomeRunFatPitchDown = crossingDownSum == 5;
I do this right?
=================
EDIT AHA! You're only talking about the line thickness, right? haha- just looked more closely at your chart.
Edited 1 time(s). Last edit at 11/25/2015 04:41PM by baffled1.
|
Re: MA_DEV indicator November 26, 2015 06:12PM |
Registered: 8 years ago Posts: 161 |
IMPROVEMENT SUGGESTIONS REQUESTED. Code is below chart image.
I got to wondering how much price deviates from a given MA. I tested it on EURUSD H1 and /es 10min and results aren't the Holy Grail but pretty darn good, imo. Top and bottom plots ("dev1top" and "dev1bot" are maximum deviations above/below an MA. "dev1" and "dev2" are identical plots (shown as the oscillator) and you can reset either of them using the charting screen inputs to observe their crosses (but I'm still studying the value of that so they're shown here as a single plot with a "9" value). There was a problem when I first started testing this a week ago: sometimes dev1 and dev2 "hang" at the oversold or overbought lines ("dev1top" and "dev1bot", just like an rsi will hang sometimes. But overall, the bounces off them are reliable. Still, I found it annoying so I added a midline plot ("topbotavg" that's the average of the oversold/overbought lines. So I can take my chances on the bounce off "dev1top" or "dev1bot", OR I can wait for a midline cross and catch the next train for at least one candle. This is a USE LEFT AXIS image so there's no direct relationship between price bars and the study. Just watch what happens to price as the oscillator bounces off overbought (dev1bot) or oversold (dev1top) or moves within the clouds or across the midline.
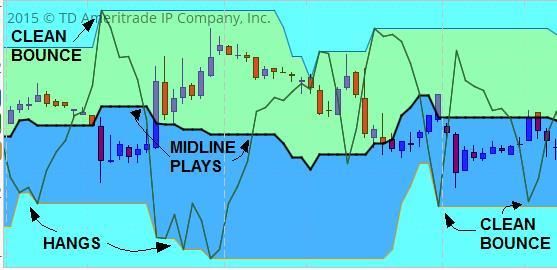
#After loading this, it will flatline study and price at top and bottom of chart, so just right-click on the study flatline and "Use Left Axis"; if you prefer lower study, add "declare lower;" to code
Edited 3 time(s). Last edit at 11/26/2015 06:22PM by baffled1.
I got to wondering how much price deviates from a given MA. I tested it on EURUSD H1 and /es 10min and results aren't the Holy Grail but pretty darn good, imo. Top and bottom plots ("dev1top" and "dev1bot"
are maximum deviations above/below an MA. "dev1" and "dev2" are identical plots (shown as the oscillator) and you can reset either of them using the charting screen inputs to observe their crosses (but I'm still studying the value of that so they're shown here as a single plot with a "9" value). There was a problem when I first started testing this a week ago: sometimes dev1 and dev2 "hang" at the oversold or overbought lines ("dev1top" and "dev1bot", just like an rsi will hang sometimes. But overall, the bounces off them are reliable. Still, I found it annoying so I added a midline plot ("topbotavg" that's the average of the oversold/overbought lines. So I can take my chances on the bounce off "dev1top" or "dev1bot", OR I can wait for a midline cross and catch the next train for at least one candle. This is a USE LEFT AXIS image so there's no direct relationship between price bars and the study. Just watch what happens to price as the oscillator bounces off overbought (dev1bot) or oversold (dev1top) or moves within the clouds or across the midline.
#After loading this, it will flatline study and price at top and bottom of chart, so just right-click on the study flatline and "Use Left Axis"; if you prefer lower study, add "declare lower;" to code
input price = hlc3;
input myavgrange = 9;
input myavgrange2 = 9;
input devrange = 20;
def myavg = average(price,myavgrange);
def myavg2 = average(price,myavgrange2);
plot dev1 = myavg-price;
plot dev2 = myavg2-price;
plot dev1top = highest(dev1,devrange);
plot dev1bot = lowest(dev1,devrange);
plot topbotavg = (dev1top+dev1bot)/2;
AddCloud(dev1top,topbotavg,color.yellow);
AddCloud(topbotavg,dev1bot,color.blue);
Edited 3 time(s). Last edit at 11/26/2015 06:22PM by baffled1.
|
Re: Using levels from EOD charts in intraday charts November 27, 2015 07:57AM |
Registered: 8 years ago Posts: 61 |
|
Re: Using levels from EOD charts in intraday charts November 27, 2015 04:04PM |
Registered: 8 years ago Posts: 161 |
Tampman Wrote:
-------------------------------------------------------
> Baffled - yes...lol.. i just made the lines
> thicker..
------------------------------------------------------
Thanks, Tampman- sometimes I'm a little slow on the uptake
Since you trade /es, you might like this... I subscribe to hardcopy Modern Trader (formerly Futures Magazine). A Dec 2015 piece by Bramesh Bhandari discussed the Arms Index. On TOS it's $TRIN (click symbol dropdown, then it's under "Indicators". It's aka the TRIN Index- a search gives lots of results but you probably can't access the Modern Trader article unless you're a subscriber. I don't know TOS's underlying calc for $TRIN but the original calc from Richard Arms (c. 1967) is:
TRIN = ADR/ADVR, where ADR = (advancing issues)/(declining issues) and ADVR = (volume advancers)/(volume of decliners).
According to the article, 1.0 is neutral (stay at cash), below 0.5 is possible short, above 2.0 possible long.
If you run $TRIN on TOS, it charts like any other symbol and I forgot how to run more than one symbol at the same time so my workaround for now is to run a lower study:
On /es 10m it picks up the long signals well, but not the short ones, imo. You might fiddle with it to get better stuff, or code the original calc as a price overlay? Won't help me because eurusd/spy correlation is very sketchy. So I have to do something similar within a forex framework. Just thought you might like to know.
Edited 7 time(s). Last edit at 11/27/2015 04:10PM by baffled1.
-------------------------------------------------------
> Baffled - yes...lol.. i just made the lines
> thicker..
------------------------------------------------------
Thanks, Tampman- sometimes I'm a little slow on the uptake
Since you trade /es, you might like this... I subscribe to hardcopy Modern Trader (formerly Futures Magazine). A Dec 2015 piece by Bramesh Bhandari discussed the Arms Index. On TOS it's $TRIN (click symbol dropdown, then it's under "Indicators"
. It's aka the TRIN Index- a search gives lots of results but you probably can't access the Modern Trader article unless you're a subscriber. I don't know TOS's underlying calc for $TRIN but the original calc from Richard Arms (c. 1967) is:
TRIN = ADR/ADVR, where ADR = (advancing issues)/(declining issues) and ADVR = (volume advancers)/(volume of decliners).
According to the article, 1.0 is neutral (stay at cash), below 0.5 is possible short, above 2.0 possible long.
If you run $TRIN on TOS, it charts like any other symbol and I forgot how to run more than one symbol at the same time so my workaround for now is to run a lower study:
declare lower;
plot nysetrin = hlc3("$TRIN" );
(arrgghhh- hadda keep Editing to get rid of smiley, so is extra space after $TRIN above)
On /es 10m it picks up the long signals well, but not the short ones, imo. You might fiddle with it to get better stuff, or code the original calc as a price overlay? Won't help me because eurusd/spy correlation is very sketchy. So I have to do something similar within a forex framework. Just thought you might like to know.
Edited 7 time(s). Last edit at 11/27/2015 04:10PM by baffled1.
|
Re: Using levels from EOD charts in intraday charts November 29, 2015 10:39AM |
Registered: 8 years ago Posts: 61 |
|
Re: Using levels from EOD charts in intraday charts November 29, 2015 06:13PM |
Registered: 8 years ago Posts: 161 |
Tampman Wrote:
-------------------------------------------------------
> Baffled - thanks... yes I know TRIN..and use it on
> TOS already.. BTW, in case you didn't see it... I
> sent you a PM...
-------------------------------------------------------
Tampman, got it, thanks. Was looking for something a little longer-term and this may serve. Get back to you. So I guess everybody already knew about TRIN . Was pulling my hair out last night adapting it to Forex. Getting closer, tho. I can see that maybe I only need to use four pairs in the calc- or maybe just two. Now at the point of setting trigger lines... I heard this song by Sting the other day "Shape of My Heart" and man it rang so true, about the guy who deals the cards "as a meditation..." to find "the sacred geometry of chance", not just for the money he wins. I think a lot of us here are that way.
My Motto: The way I figure, in this racket, if you're not losing money, you're better than most. After that, making money is easy.
-------------------------------------------------------
> Baffled - thanks... yes I know TRIN..and use it on
> TOS already.. BTW, in case you didn't see it... I
> sent you a PM...
-------------------------------------------------------
Tampman, got it, thanks. Was looking for something a little longer-term and this may serve. Get back to you. So I guess everybody already knew about TRIN
. Was pulling my hair out last night adapting it to Forex. Getting closer, tho. I can see that maybe I only need to use four pairs in the calc- or maybe just two. Now at the point of setting trigger lines... I heard this song by Sting the other day "Shape of My Heart" and man it rang so true, about the guy who deals the cards "as a meditation..." to find "the sacred geometry of chance", not just for the money he wins. I think a lot of us here are that way.
My Motto: The way I figure, in this racket, if you're not losing money, you're better than most. After that, making money is easy.
|
Re: Using levels from EOD charts in intraday charts November 29, 2015 08:57PM |
Admin Registered: 13 years ago Posts: 131 |
|
Re: Fun with ThinkScript December 06, 2015 07:24PM |
Registered: 8 years ago Posts: 1 |
|
Re: Fun with ThinkScript December 10, 2015 03:04PM |
Registered: 8 years ago Posts: 7 |
a script that will alert me when the Bollinger Bands breaks and MA 2 is above or below 20, 50 and 200 MA and has a volume spike
good for 1 min chart for intraday breakouts
Edited 1 time(s). Last edit at 12/10/2015 06:01PM by xilb51x.
good for 1 min chart for intraday breakouts
# 3 moving averages crossover signals

input SMA_short = 5;
input SMA_medium = 20;
input SMA_long = 50;

def AvgS = Average(close, SMA_short);
def AvgM = Average(close, SMA_medium);
def AvgL = Average(close, SMA_long);
def Candle_White = close > open;
def Candle_Red = close < open;

def Eup = (AvgS > AvgM and AvgM > AvgL);
def Edn = (AvgS < AvgM and AvgM < AvgL);
def CrossUp = Eup and !Eup[1] and close > AvgM;
def CrossDn = Edn and !Edn[1] and close < AvgM;

def BuySignalUp = if (Eup and Candle_White and CrossUp[0] and close > (if Candle_White[1] then close[1] else open[1])) then 1
        else
            if (Eup and Candle_White and CrossUp[1] and close[1] < (if Candle_White[2] then close[2] else open[2]) and close > (if Candle_White[2] then close[2] else open[2])) then 1
        else
            Double.NaN;

def BuySignalDn = if (Edn and Candle_Red and CrossDn[0] and close < (if Candle_Red[1] then close[1] else open[1])) then 1
        else
            if (Edn and Candle_Red and CrossDn[1] and close[1] > (if Candle_Red[2] then close[2] else open[2]) and close < (if Candle_Red[2] then close[2] else open[2])) then 1
        else
            Double.NaN;

def strongEup = Eup and close > AvgS;
def strongEdn = Edn and close < AvgS;


#VOLUME SPIKE
input AverageLength = 10;
input VolumeMultiplier = 3;
input MinutesAfterOpen = 1;

def AvgVol = average(volume, AverageLength);
def VolX = (volume > AvgVol * VolumeMultiplier) and (secondsfromtime(0930) >= 60 * MinutesAfterOpen);

#Out of Bounds
def sDev = StDev(close, 21);
def MidLine = Average(close, 21);
def UpperBand = MidLine + 2 * sDev;
def LowerBand = MidLine - 2 * sDev;
def CloseAbove = if close > UpperBand then 1 else Double.NaN;
def CloseBelow = if close < LowerBand then 1 else Double.NaN;


Alert(CloseAbove and VolX and strongEup , Concat(GetSymbolPart(), " Above Upper Band." ), Alert.BAR, Sound.Bell);

Alert(CloseBelow and Volx and strongEdn , Concat(GetSymbolPart(), " Below Lower Band" ), Alert.BAR, Sound.Bell);
Edited 1 time(s). Last edit at 12/10/2015 06:01PM by xilb51x.
|
Re: Fun with ThinkScript December 11, 2015 12:25PM |
Registered: 8 years ago Posts: 59 |
I've been working on something for years to help me find stocks that have a propensity (on an intraday scale) to move upward much more than others. This script has a slight alteration that allows me to see the actual values in the high and low bubbles. What I'd like to do is convert it to a watchlist script that will add up the difference between each low and high bubble and divide that value by the number of low bubbles on the chart. This gives an average intraday bounce value for all the up spikes. With Think Or Swim's Scanner by converting this value to a percentage it's possible to find the stocks that have the highest intraday (up) momentum. The script is too complicated for me to pull apart, is there anyone here that can see the value in this and make the vision a reality? The data is already there in the script, It just needs to be manipulated properly. Thanks.
Edited 1 time(s). Last edit at 12/11/2015 01:01PM by Ralph53.
## START CODE
## ZigZagSign TOMO modification, v0.2 written by Linus @Thinkscripter Lounge adapted from Thinkorswim ZigZagSign Script

input price             = close;
input priceH            = high;    # swing high
input priceL            = low;     # swing low
input ATRreversalfactor = 3.2;
def ATR                 = reference ATR(length = 5);
def reversalAmount      = ATRreversalfactor * ATR;
input showlines         = no;
input displace          = 1;
input showBubbleschange = yes;


def barNumber = BarNumber();
def barCount = HighestAll(If(IsNaN(price), 0, barNumber));

rec state = {default init, undefined, uptrend, downtrend};
rec minMaxPrice;

if (GetValue(state, 1) == GetValue(state.init, 0)) {
    minMaxPrice = price;
    state = state.undefined;
} else if (GetValue(state, 1) == GetValue(state.undefined, 0)) {
    if (price <= GetValue(minMaxPrice, 1) - reversalAmount) {
        state = state.downtrend;
        minMaxPrice = priceL;
    } else if (price >= GetValue(minMaxPrice, 1) + reversalAmount) {
        state = state.uptrend;
        minMaxPrice = priceH;
    } else {
        state = state.undefined;
        minMaxPrice = GetValue(minMaxPrice, 1);
    }
} else if (GetValue(state, 1) == GetValue(state.uptrend, 0)) {
    if (price <= GetValue(minMaxPrice, 1) - reversalAmount) {
        state = state.downtrend;
        minMaxPrice = priceL;
    } else {
        state = state.uptrend;
        minMaxPrice = Max(priceH, GetValue(minMaxPrice, 1));
    }
} else {
    if (price >= GetValue(minMaxPrice, 1) + reversalAmount) {
        state = state.uptrend;
        minMaxPrice = priceH;
    } else {
        state = state.downtrend;
        minMaxPrice = Min(priceL, GetValue(minMaxPrice, 1));
    }
}

def isCalculated = GetValue(state, 0) != GetValue(state, 1) and barNumber >= 1;
def futureDepth =  barCount - barNumber;
def tmpLastPeriodBar;
if (isCalculated) {
    if (futureDepth >= 1 and GetValue(state, 0) == GetValue(state, -1)) {
        tmpLastPeriodBar = fold lastPeriodBarI = 2 to futureDepth + 1 with lastPeriodBarAcc = 1
            while lastPeriodBarAcc > 0
            do if (GetValue(state, 0) != GetValue(state, -lastPeriodBarI))
                then -lastPeriodBarAcc
                else lastPeriodBarAcc + 1;
    } else {
        tmpLastPeriodBar = 0;
    }
} else {
    tmpLastPeriodBar = Double.NaN;
}

def lastPeriodBar = if (!IsNaN(tmpLastPeriodBar)) then -AbsValue(tmpLastPeriodBar) else -futureDepth;

rec currentPriceLevel;
rec currentPoints;
if (state == state.uptrend and isCalculated) {
    currentPriceLevel =
        fold barWithMaxOnPeriodI = lastPeriodBar to 1 with barWithMaxOnPeriodAcc = minMaxPrice
            do Max(barWithMaxOnPeriodAcc, GetValue(minMaxPrice, barWithMaxOnPeriodI));
    currentPoints =
        fold maxPointOnPeriodI = lastPeriodBar to 1 with maxPointOnPeriodAcc = Double.NaN
            while IsNaN(maxPointOnPeriodAcc)
            do if (GetValue(priceH, maxPointOnPeriodI) == currentPriceLevel)
                then maxPointOnPeriodI
                else maxPointOnPeriodAcc;
} else if (state == state.downtrend and isCalculated) {
    currentPriceLevel =
        fold barWithMinOnPeriodI = lastPeriodBar to 1 with barWithMinOnPeriodAcc = minMaxPrice
            do Min(barWithMinOnPeriodAcc, GetValue(minMaxPrice, barWithMinOnPeriodI));
    currentPoints =
        fold minPointOnPeriodI = lastPeriodBar to 1 with minPointOnPeriodAcc = Double.NaN
            while IsNaN(minPointOnPeriodAcc)
            do if (GetValue(priceL, minPointOnPeriodI) == currentPriceLevel)
                then minPointOnPeriodI
                else minPointOnPeriodAcc;
} else if (!isCalculated and (state == state.uptrend or state == state.downtrend)) {
    currentPriceLevel = GetValue(currentPriceLevel, 1);
    currentPoints = GetValue(currentPoints, 1) + 1;
} else {
    currentPoints = 1;
    currentPriceLevel = GetValue(price, currentPoints);
}

plot "ZZ$" = if (barNumber == barCount or barNumber == 1) then if state == state.uptrend then priceH else priceL else if (currentPoints == 0) then currentPriceLevel else Double.NaN;

rec zzSave =  if !IsNaN("ZZ$" ) then if (barNumber == barCount or barNumber == 1) then if IsNaN(barNumber[-1]) and  state == state.uptrend then priceH else priceL else currentPriceLevel else GetValue(zzSave, 1);

def chg = (if barNumber == barCount and currentPoints < 0 then priceH else if barNumber == barCount and currentPoints > 0 then priceL else currentPriceLevel) - GetValue(zzSave, 1);

def isUp = chg >= 0;

#Higher/Lower/Equal High, Higher/Lower/Equal Low
def xxhigh = if zzSave == priceH then Round(high, 2) else Round(xxhigh[1], 2);
def chghigh = Round(Round(high, 2) - Round(xxhigh[1], 2), 2);
def xxlow = if zzSave == priceL then Round(low, 2) else Round(xxlow[1], 2);
def chglow = Round(Round(low, 2) - Round(xxlow[1], 2), 2);


rec isConf = AbsValue(chg) >= reversalAmount or (IsNaN(GetValue("ZZ$", 1)) and GetValue(isConf, 1));

"ZZ$".EnableApproximation();
"ZZ$".DefineColor("Up Trend", Color.UPTICK);
"ZZ$".DefineColor("Down Trend", Color.DOWNTICK);
"ZZ$".DefineColor("Undefined", Color.WHITE);
"ZZ$".AssignValueColor(if !isConf then "ZZ$".Color("Undefined" ) else if isUp then "ZZ$".Color("Up Trend" ) else "ZZ$".Color("Down Trend" ));

DefineGlobalColor("Unconfirmed", Color.WHITE);
DefineGlobalColor("Up", Color.UPTICK);
DefineGlobalColor("Down", Color.DOWNTICK);

AddChartBubble(showBubbleschange and !IsNaN("ZZ$" ) and barNumber != 1, if isUp then high else low , Round(if isUp then high else low, 2) , if barCount == barNumber or !isConf then GlobalColor("Unconfirmed" ) else if isUp then GlobalColor("Up" ) else GlobalColor("Down" ), isUp);


## END CODE
Edited 1 time(s). Last edit at 12/11/2015 01:01PM by Ralph53.
|
Re: Fun with ThinkScript December 12, 2015 10:29PM |
Registered: 8 years ago Posts: 1 |
Hey Robert,
How are you?
As a teacher, I wish you the best in your studies !
I want to purchase some of your scripts and have ideas for new ones.
e-mail: tona533741@gmail.com
Let me know.
thanks,
Al
How are you?
As a teacher, I wish you the best in your studies !
I want to purchase some of your scripts and have ideas for new ones.
e-mail: tona533741@gmail.com
Let me know.
thanks,
Al
|
Re: Fun with ThinkScript December 13, 2015 10:34PM |
Registered: 10 years ago Posts: 464 |
@ Ralph53,
Without comparing the script line by line, this looks like the autowave script that many of us use in TOS to provide the autowave lines on the charts. Like I said, I haven't done a line by line comparison of both scripts so I can't say for sure, but I think I'm right.
Not real sure how that script is gonna provide info that would allow one to know that one stock is gonna move farther than another stock though. Robert or someone else may have a better idea of that. As far as a watchlist scan, ya got me there.
|
Re: Fun with ThinkScript December 16, 2015 11:04AM |
Registered: 10 years ago Posts: 143 |
Hello traders,
This is my Christmas gift for all reversal traders here
It works on all time frames so both day traders and swing traders can use it. It plots a green up arrow when there is a potential reversal to upside and a red down arrow when there is a potential reversal to downside and gives an audible and written alert when signal is generated. The entry point is at the open of the candlestick with the arrow. Be careful and always use stop losses. Paper trade first and see if this indicator wins for you over the long term.
It gives you an option to change the Stochastic oversold and overbought levels,
input inputStochLong = 20;
input inputStochShort = 80;
# return %k for going long or short on stochastics
def StochLong = StochasticFull(80,20,10,10,High,Low,Close,3, "SMA" ).FastK;
def longOneFilter = StochLong[1] < inputStochLong;
def shortOneFilter = StochLong[1] > inputStochShort;
#volume signal parameters
def AvgVol = Average(volume, 6);
def VolUP = volume > AvgVol and volume > volume[1]*0.75;
#long and short signal formula
plot SignalBuy = if close[1] > close[2] and VolUP[1] and longOneFilter and StochLong[1] >= StochLong[2] then low else Double.nan;
plot SignalSell = if close[1] < close[2] and VolUP[1] and shortOneFilter and StochLong[1] <= StochLong[2] then high else Double.nan;
# show up arrow for buy signal and down arrow for sell signal
SignalBuy.SetPaintingStrategy(PaintingStrategy.ARROW_UP);
SignalBuy.AssignValueColor(color.UPTICK);
SignalSell.SetpaintingStrategy(PaintingStrategy.ARROW_DOWN);
SignalSell.AssignValueColor(color.RED);
# show alert and make sound
alert(SignalBuy, " Time to go long", alert.BAR, sound.Ring);
alert(SignalSell, " Time to go short", alert.BAR, sound.Ring);
Good luck
Edited 2 time(s). Last edit at 12/16/2015 11:30AM by tanman.
|
Re: Fun with ThinkScript December 16, 2015 04:39PM |
Registered: 8 years ago Posts: 4 |
Hi Robert,
On April 13, 2015 (Page 21 of this thread) you posted a script for calculating the Put/Call Ratio, with an additional display showing whether the ratio is bearish, bullish or neutral. I pasted the code into my TOS platform and I updated the 3 option expiration dates for Dec, Jan and Feb. The dates being 20151218, 20160215,20160219.
TOS is displaying "Put Volume: 0", "Call Volume: 0", and "P/C: NA" I was hoping you could help me out with this.... I am obviously missing something! Thanks so much for your help!
Jerry
|
Re: Fun with ThinkScript December 16, 2015 06:21PM |
Registered: 8 years ago Posts: 4 |
Okay, here is a simple script to Print my Put/Call Ratio, and base the color on whether the Ratio is Bullish, Bearish or Neutral. The only thing that I don't know how to do is assign the variable "PutCall" with the calculated value displayed by $PCALL. Does anyone know the answer to this? Thanks.
# Put/Call (Bullish; Bearish; Neutral)
def PutCall = close ("$PCALL" );
def Bullish = PutCall <= .75;
def Bearish = PutCall > 1;
AddLabel(Bullish, "Put/Call: " + Round(putcall, 2), Color.GREEN);
AddLabel(Bearish, "$Put/Call: " + Round(Putcall, 2), Color.RED);
AddLabel(!bullish and !bearish, "Put/Call: " + Round(putcall, 2), Color.WHITE);


Sorry, only registered users may post in this forum.
Trade with Knowledge, Trade with Power - ResearchTrade.com.