Fun with ThinkScript
Posted by robert
|
Re: Fun with ThinkScript July 27, 2015 03:57PM |
Registered: 9 years ago Posts: 15 |
Robert, tried this out today, wasn't really working out.
Trying to get the alarm to signal once the volume bar paints white. Alarms were going off but most times didn't coincide with the painted white bar. If you don't mind taking another peek at that would gladly contribute to the coffee cup fund. Using volume sub on 3200 tick charts for your information if that matters... Thank you.
declare lower;
declare zerobase;
plot Vol = volume;
Vol.SetPaintingStrategy(PaintingStrategy.HISTOGRAM);
Vol.SetLineWeight(3);
Vol.DefineColor("Up", Color.green);
Vol.DefineColor("Down", Color. red);
Vol.AssignValueColor(if close > close[1] then Vol.color("Up" else if close < close[1] then Vol.color("Down" else color.white);
Alert(close == close[1], GetSymbol() + " same close value as before", Alert.BAR, Sound.Bell);
Trying to get the alarm to signal once the volume bar paints white. Alarms were going off but most times didn't coincide with the painted white bar. If you don't mind taking another peek at that would gladly contribute to the coffee cup fund. Using volume sub on 3200 tick charts for your information if that matters... Thank you.
declare lower;
declare zerobase;
plot Vol = volume;
Vol.SetPaintingStrategy(PaintingStrategy.HISTOGRAM);
Vol.SetLineWeight(3);
Vol.DefineColor("Up", Color.green);
Vol.DefineColor("Down", Color. red);
Vol.AssignValueColor(if close > close[1] then Vol.color("Up"
else if close < close[1] then Vol.color("Down" else color.white);
Alert(close == close[1], GetSymbol() + " same close value as before", Alert.BAR, Sound.Bell);
|
Re: Fun with ThinkScript July 27, 2015 04:44PM |
Registered: 10 years ago Posts: 615 |
Quote
mark1234
Robert, tried this out today, wasn't really working out.
Trying to get the alarm to signal once the volume bar paints white. Alarms were going off but most times didn't coincide with the painted white bar. If you don't mind taking another peek at that would gladly contribute to the coffee cup fund. Using volume sub on 3200 tick charts for your information if that matters... Thank you.
Gotcha. Now I see that the problem is with how I set the alert up. While the current candle is still actively changing, it may turn white for a moment as the close matches the previous close. When that happens, the alert sounds. However, the candle may change and not be white at the end of the time period. So, I need to change the alert to only check for the white bars after the candle has finished painting.
Use this alert instead.
Alert(close[1] == close[2], GetSymbol() + " same close value as before", Alert.BAR, Sound.Bell);
- robert

Professional ThinkorSwim indicators for the average Joe
|
Re: Fun with ThinkScript July 27, 2015 07:50PM |
Registered: 8 years ago Posts: 161 |
Well, I got ambitious. Made a Daily trade with the Evil Algo (see http://www.researchtrade.com/forum/read.php?7,2258,5399#msg-5399 ). Entered short last Thursday about 5pm ET. Early Friday offered me a 60-pip EURUSD gain. But I had an 80-p target so I sneered at it. Burned, had to upload funds to cover. Still in. Drop coming. Figured out why I should've taken the 60p offered- has to do with Width setting. I was accidentally running 30-width (for Hourly) on a Daily that needs a 60-width. Would have been fine if I'd realized I was doing it. Anyway, I also got curious about drawdowns vs gains after signal and this chart shows:
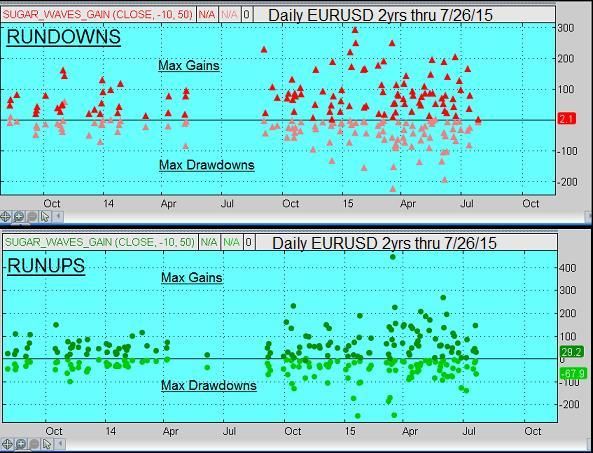
...which I consider a nice distribution so I'll keep trading this way. Also shows me worst case across 2 years. If you want to further analyze, here's the code. You'll have to set it to dots, triangles, and colors from your chart screen. I included the entire code but made much of it non-functional with "#"s. :
Edited 1 time(s). Last edit at 07/27/2015 07:59PM by baffled1.
...which I consider a nice distribution so I'll keep trading this way. Also shows me worst case across 2 years. If you want to further analyze, here's the code. You'll have to set it to dots, triangles, and colors from your chart screen. I included the entire code but made much of it non-functional with "#"s. :
declare lower;
input price = close;
 input length = -50;

 def displacement = (length / 2) + 1;
 def dPrice = price[displacement];

 def tmp = if !IsNaN(dPrice) then Average(dPrice, AbsValue(length)) else tmp[1] + (tmp[1] - tmp
 [2]);
 def tmp1 = if !IsNaN(price) then tmp else Double.NaN;

#plot Data = tmp1;
# Data.SetDefaultColor(color.CYAN );
# Data.SetStyle(Curve.SHORT_DASH);
 def pct=100;
 input width=65;
 def d=width/pct;
 def d1=0.8*d;
 def d2=1.05*d;
 def d3=1.15*d;
 def stdDeviation = Highestall("data" = AbsValue(tmp1 - price));
#UpperLine and LowerLine are first interior boundaries
#plot UpperLine = tmp1 + stdDeviation*d1;
#plot LowerLine = tmp1 - stdDeviation*d1;
def UpperLine = tmp1 + stdDeviation*d1;
def LowerLine = tmp1 - stdDeviation*d1;
#From here down to "End Here" is analysis code. If you want to run this as upper study without analysis,
#then delete this section (and delete "declare lower" ) and remove all remaining "#"s.
def rundown = UpperLine <= high;
def runup = LowerLine >= low;
plot rundownGAIN = if rundown then (close-low[-1])*10000 else double.NaN;
plot runupGAIN = if runup then (high[-1]-close)*10000 else double.NaN;
plot rundownLOSS = if rundown then (close-high[-1])*10000 else double.NaN;
plot runupLOSS = if runup then (low[-1]-close)*10000 else double.NaN;
plot zeroline = 0;
#End Here.
#plot UpperLine1 = tmp1 + stdDeviation*d2;
#plot LowerLine1 = tmp1 - stdDeviation*d2;
#plot UpperLine2 = tmp1 + stdDeviation*d3;
#plot LowerLine2 = tmp1 - stdDeviation*d3;
#UpperLine.SetDefaultColor(color.red);
#UpperLine1.SetDefaultColor(color.red );
#UpperLine2.SetDefaultColor(color.red );
#LowerLine.SetDefaultColor(color.cyan );
#LowerLine1.SetDefaultColor(color.cyan );

#LowerLine2.SetDefaultColor(color.cyan );
#AddCloud(UpperLine,UpperLine1,color.plum,color.plum);
 #AddCloud(LowerLine,LowerLine1,color.green,color.dark_green);
Edited 1 time(s). Last edit at 07/27/2015 07:59PM by baffled1.
|
Re: Fun with ThinkScript July 27, 2015 08:32PM |
Registered: 9 years ago Posts: 15 |
|
Re: Fun with ThinkScript July 28, 2015 06:00AM |
Registered: 10 years ago Posts: 615 |
Quote
Mark1234
Thanks Robert, small token of my appreciation sent your way.
Very much appreciated. Thank you.
- robert
Professional ThinkorSwim indicators for the average Joe
|
Option Volume Custom Scan Filter ToS July 28, 2015 12:57AM |
Registered: 8 years ago Posts: 1 |
Hi,
How do I make a Scanner Custom Filter scan in the thinkscript editor using Option Volume?
In the thinkscript editor on the Option Hacker page, I am currently using the 'Volume' keyword in a Study Filter, but that appears to be normal trading volume not the option volume.
If I make a similar script in Search Results of the Option Hacker and use the same 'Volume' keyword for the column's thinkscript, it correctly uses Option Volume.
Thanks!
|
Re: Option Volume Custom Scan Filter ToS July 28, 2015 04:25AM |
Registered: 10 years ago Posts: 615 |
Quote
habibalex
How do I make a Scanner Custom Filter scan in the thinkscript editor using Option Volume?
In the thinkscript editor on the Option Hacker page, I am currently using the 'Volume' keyword in a Study Filter, but that appears to be normal trading volume not the option volume.
If I make a similar script in Search Results of the Option Hacker and use the same 'Volume' keyword for the column's thinkscript, it correctly uses Option Volume.
It looks like it's built in to the scanner. "Add option filter" then on the option line, select "volume."


- robert
Professional ThinkorSwim indicators for the average Joe
|
Re: Fun with ThinkScript July 28, 2015 11:24PM |
Registered: 9 years ago Posts: 15 |
Robert, this baby still not working out,
just not getting the alert after the white volume bars paint.
PS. Any idea why this copy paste ("Up"("Down" posts with the smilies?
Thanks
declare lower;
declare zerobase;
plot Vol = volume;
Vol.SetPaintingStrategy(PaintingStrategy.HISTOGRAM);
Vol.SetLineWeight(3);
Vol.DefineColor("Up", Color.green);
Vol.DefineColor("Down", Color. red);
Vol.AssignValueColor(if close > close[1] then Vol.color("Up" else if close < close[1] then Vol.color("Down" else color.white);
Alert(close[1] == close[2], GetSymbol() + " same close value as before", Alert.BAR, Sound.Bell);
robert Wrote:
-------------------------------------------------------
> > Robert, tried this out today, wasn't really
> working out.
> Trying to get the alarm to signal once the volume
> bar paints white. Alarms were going off but most
> times didn't coincide with the painted white bar.
> If you don't mind taking another peek at that
> would gladly contribute to the coffee cup fund.
> Using volume sub on 3200 tick charts for your
> information if that matters... Thank you.
>
>
> Gotcha. Now I see that the problem is with how I
> set the alert up. While the current candle is
> still actively changing, it may turn white for a
> moment as the close matches the previous close.
> When that happens, the alert sounds. However, the
> candle may change and not be white at the end of
> the time period. So, I need to change the alert
> to only check for the white bars after the candle
> has finished painting.
>
> Use this alert instead.
>
>
> Alert(close[1] == close[2], GetSymbol() + " same
> close value as before", Alert.BAR, Sound.Bell);
>
just not getting the alert after the white volume bars paint.
PS. Any idea why this copy paste ("Up"
("Down" posts with the smilies?
Thanks
declare lower;
declare zerobase;
plot Vol = volume;
Vol.SetPaintingStrategy(PaintingStrategy.HISTOGRAM);
Vol.SetLineWeight(3);
Vol.DefineColor("Up", Color.green);
Vol.DefineColor("Down", Color. red);
Vol.AssignValueColor(if close > close[1] then Vol.color("Up"
else if close < close[1] then Vol.color("Down" else color.white);
Alert(close[1] == close[2], GetSymbol() + " same close value as before", Alert.BAR, Sound.Bell);
robert Wrote:
-------------------------------------------------------
> > Robert, tried this out today, wasn't really
> working out.
> Trying to get the alarm to signal once the volume
> bar paints white. Alarms were going off but most
> times didn't coincide with the painted white bar.
> If you don't mind taking another peek at that
> would gladly contribute to the coffee cup fund.
> Using volume sub on 3200 tick charts for your
> information if that matters... Thank you.
>
>
> Gotcha. Now I see that the problem is with how I
> set the alert up. While the current candle is
> still actively changing, it may turn white for a
> moment as the close matches the previous close.
> When that happens, the alert sounds. However, the
> candle may change and not be white at the end of
> the time period. So, I need to change the alert
> to only check for the white bars after the candle
> has finished painting.
>
> Use this alert instead.
>
>
> Alert(close[1] == close[2], GetSymbol() + " same
> close value as before", Alert.BAR, Sound.Bell);
>
|
Re: Fun with ThinkScript July 29, 2015 12:45AM |
Registered: 10 years ago Posts: 615 |
Quote
Mark1234
Robert, this baby still not working out,
just not getting the alert after the white volume bars paint.
Hrmmm...I'm not sure what else to do because the code should be working. In fact I tested it last night before posting then again a few minutes ago after reading your post and it worked as expected both times. Please watch this video showing that, at least in my testing, the alert seems to work.
Quote
Mark1234
PS. Any idea why this copy paste ("Up"
This forum has "automatic smiley" enabled. So anytime the message board encounters a quotation mark followed immediately by a close parenthesis it automatically converts that to a winking smiley. Like so...
") automatically becomes "
To get around this when I post scripts, I will first open my script in a text editor then do a search and replace as follows:
search for: ")
replace with: " ) (that's [quotation mark][space][close parenthesis] )
After doing that I then paste my script on here.
Before:
def dailyHigh = high(period = "day"
After:
def dailyHigh = high(period = "day" );
- robert
Professional ThinkorSwim indicators for the average Joe
Edited 1 time(s). Last edit at 07/29/2015 12:55AM by robert.
|
Re: Fun with ThinkScript July 29, 2015 10:48AM |
Registered: 9 years ago Posts: 15 |
re copied and pasted did a complete system reboot and now getting the alerts...think it's good to go.
Thanks
robert Wrote:
-------------------------------------------------------
> > Robert, this baby still not working out,
> just not getting the alert after the white volume
> bars paint.
>
>
> Hrmmm...I'm not sure what else to do because the
> code should be working. In fact I tested it last
> night before posting then again a few minutes ago
> after reading your post and it worked as expected
> both times. Please watch this video showing that,
> at least in my testing, the alert seems to work.
>
>
> PS. Any idea why this copy paste ("Up"("Down"
> posts with the smilies?
>
>
> This forum has "automatic smiley" enabled. So
> anytime the message board encounters a quotation
> mark followed immediately by a close parenthesis
> it automatically converts that to a winking
> smiley. Like so...
>
> " automatically becomes "
>
> To get around this when I post scripts, I will
> first open my script in a text editor then do a
> search and replace as follows:
>
> search for: "
> replace with: " ) (that's )
>
> After doing that I then paste my script on here.
>
> Before:
>
>
> def dailyHigh = high(period = "day";
>
>
> After:
>
>
> def dailyHigh = high(period = "day" );
>
Thanks
robert Wrote:
-------------------------------------------------------
> > Robert, this baby still not working out,
> just not getting the alert after the white volume
> bars paint.
>
>
> Hrmmm...I'm not sure what else to do because the
> code should be working. In fact I tested it last
> night before posting then again a few minutes ago
> after reading your post and it worked as expected
> both times. Please watch this video showing that,
> at least in my testing, the alert seems to work.
>
>
> PS. Any idea why this copy paste ("Up"
("Down"
> posts with the smilies?
>
>
> This forum has "automatic smiley" enabled. So
> anytime the message board encounters a quotation
> mark followed immediately by a close parenthesis
> it automatically converts that to a winking
> smiley. Like so...
>
> "
automatically becomes "
>
> To get around this when I post scripts, I will
> first open my script in a text editor then do a
> search and replace as follows:
>
> search for: "
> replace with: " ) (that's )
>
> After doing that I then paste my script on here.
>
> Before:
>
>
> def dailyHigh = high(period = "day"
;
>
>
> After:
>
>
> def dailyHigh = high(period = "day" );
>
|
Re: Fun with ThinkScript July 29, 2015 10:53AM |
Registered: 10 years ago Posts: 615 |
Quote
Mark1234
re copied and pasted did a complete system reboot and now getting the alerts...think it's good to go.
Glad to hear it. Thanks for the follow-up.
- robert
Professional ThinkorSwim indicators for the average Joe
|
Re: Fun with ThinkScript July 31, 2015 07:36AM |
Registered: 8 years ago Posts: 3 |
Hello all,
I'm trying to get the highest/lowest value from a custom indicator in the current aggregation period using barNumber(). The code that I'm using is similar to the below:
Hi = highest(custom_indicator_name, barNumber()) ;
Lo = lowest(custom_indicator_name, barNumber()) ;
When I do this, I get an syntax error stating "Only constants expected here: barNumber() CL constant function parameter 'length' at blah"
I've tried a few ways to extract the value of barNumber() to turn into a constant but with no avail. Any suggestions would be greatly appreciated!
|
Re: Fun with ThinkScript July 31, 2015 07:43AM |
Registered: 8 years ago Posts: 3 |
|
Re: Fun with ThinkScript July 31, 2015 02:29PM |
Registered: 8 years ago Posts: 161 |
 Robert, I have to thank you again for the Robert's Averaging algo. It is serving me well. I can trade it standalone with my TriplePoint algo (the one you helped me with), and I also use it to help guide me when using the Evil Algo
  . And maybe even more importantly, it gives me a template for other Averaging operations. You da man!!
|
Re: Fun with ThinkScript August 03, 2015 03:37PM |
Registered: 9 years ago Posts: 53 |
So a few weeks back I had our magician Robert put together a script that would plot the point difference when the RSI(5) crosses above the 30. The labels show where the cross was and what the difference in points was from the close of the crossing above day to the lowest low so many days after the cross.The script only looks at one cross. If there are two crosses within a 10 day period it only looks at the first cross and the second cross is never used.
I have since modified the code so you can enter inputs for the period, crossing level, and how many days to look for the lowest low after the cross. In addition, I have coded the % difference from the close to the lowest low also since this is more relevant as a symbol's price changes in value where the % change is a better guage. Incidently the percentage difference between two numbers is different than the percentage change between two numbers
So why was I doing this? I was simply looking at how much a ticker would move after the RSI exits an oversold area and go from there to figure where to write put credit spreads; recode for call spreads or add addtionale indy's as needed.
The conundrum:
I askied Robert to only look at the first cross if two happen within a given number of days. But if you wanted to 'use' this and were to do a technical scan to find when the RSI(5) crossed above your value, your scan may have happened when the second cross happened with your given days after cross input. Looking back at a chart there could have been several insntances where this happened and the results could have been very poor showings.
So the correct thing to do would be to count EVERY time this cross happened but still figure the % change for your input of days after cross. Depending on your ingredients for the cross the chart may or may not get too busy and the labels would get printed on top of each other.
Robert: I tried to cahnge this aspect of the code where EVERY cross was counted but didn'e have too much luck. Can you tweak that one line so EVERY cross is counted? If the labels overlap I should be able to visually figure it out.
The ultimate way to really figure out the probabilites and crosses is to dump all the price data in to Excel and stat away. Most of the indy's are solved from price data so that is not a problem. I'm a heavy Excel user so I'm not a'feared of that.
Here is the modified code:
input length = 5;
input DaysAfterCross = 10;
input xabove = 30;
def RSI = reference RSI(length).rsi;
def Xup = RSI crosses above xabove;
# If more than one cross up in a DaysAfterCross period, only use the first one
plot SignalUP = Xup and Sum(Xup[1], DaysAfterCross) == 0;
# Plot all the crosses
SignalUP.SetPaintingStrategy(PaintingStrategy.BOOLEAN_ARROW_UP);
SignalUP.SetDefaultColor(Color.pink);
# Get the LOWEST LOW during the DaysAfterCross following the cross up
def LL = Lowest(low, DaysAfterCross);
# plot a line at the LOWEST LOW following the cross up
def countUP = if SignalUP then 0 else countUP[1] + 1;
plot LL6 = if countUP <= DaysAfterCross then GetValue(LL, countUP - DaysAfterCross) else Double.NaN;
LL6.SetDefaultColor(Color.WHITE);
# label the lowest DaysAfterCross day low
AddChartBubble(low == LL6, low, Round(LL6), Color.WHITE);
# calculate and label the difference between the lowest DaysAfterCross day low and the close of the signal day
def diff = if low == LL6 then low - GetValue(low, countUP) else Double.NaN;
AddChartBubble(low == LL6, low, "diff: " + Round(diff), Color.LIGHT_ORANGE);
# calculate the percentage difference also
def perdiff = if low == LL6 then (low - GetValue(low, countUP)) / GetValue(low, countUP) * 100 else Double.NaN;
# Label the percentage difference
AddChartBubble(low == LL6, low +4, "%diff: " + Round(perdiff), Color.LIGHT_green);
xxxxxxx
and an example of $AAPL daily:
[i61.tinypic.com]
For everyone from a trader's perspective: I realize that there is a lot more to it than just looking for an overbught or oversold indicator; option greeks, DTE, support, % away from underlying, resistance, etc. so what would your logic be instead of just running the numbers? When I look at this in its basic form (as is) I see something that could work very well as a very promising filter or raing boundary. Any thoughts are welcome.
|
Re: Touchup to VSA Script August 11, 2015 06:49PM |
Registered: 9 years ago Posts: 7 |
Hello Robert,
I love the following script which is called volume spread analysis. It gives cues to strength and weakness with dots and what not.
It also colors the price bars red when price is nearing a turn around at the lows and Green when it reaches the High. However, those colors override the red and green of the regular chart showing when price moved up or down for that bar. Do you think you could strip out the color coding of the price bars and provide me with the ability to represent it as a volume sub graph with the volume bars colored in the same fashion?
# VSA Script
#In addition, a symbol's shape and its vertical position above or below a candle now imparts added meaning to it. In general, the strength of a symbol is assigned by its color and shape in that order. In certain circumstances a symbol's vertical offset from its candle's top or bottom strengthens the symbol's meaning. The symbol strength hierarchy is defined as follows:
# 1. Color: Symbols below candles are assigned strength from weakest to strongest in this order: white (or grey), cyan (blue/green), green. A red symbol under a candle indicates the failure of the symbol attached below the candle immediately preceding it.
# Symbols above candles are assigned strength from weakest to strongest in this order: yellow, orange, red. A green symbol above a candle indicates the failure of a symbol attached above the candle immediately preceding it. A magenta (pinkish purple) square above a candle is a special case indicating Distribution. Another special case for testing purposes as of 20100830 is a white triangle high above a candle indicating a Gravestone Doji.
# Symbols drawn on the middle of a candle are of two types with one variation. A green circle indicates Effort to Move Up on up bars. A magenta (pinkish purple) circle indicates Effort to Move Down on down bars except for red down bars on which magenta displays poorly. In order to be seen easily, yellow circles indicate Effort to Move Down on red down bars.
# 2. Shape: A symbol of a given color is assigned increasing strength according to this hierarchy (from low to high): circle, square, triangle, downward or upward arrow. In certain circumstances two symbols of the same shape and color will be stacked vertically, adding strength through the combined symbols. Occasionally, two different symbols will be stacked vertically because that candle satisfies the criteria for two indications.
# Listed below are the symbols and their meanings. The original symbol chart can be found at the end of this study.
# ___Symbols Below Candles___
# White Square - Test for Supply
# Cyan Circle - No Supply
# Cyan Triangle - Successful Test for Supply
# 2 Cyan Triangles - Successful Test for Supply 2
# Grey Square - Test for Supply in Uptrend
# Green Circle - Stopping Volume
# Cyan Square - Strength in Downtrend
# Green Square - Strength in Downtrend 1
# Green Triangle - Strength in Downtrend 2
# Green UpArrow - Strength Confirmation Bar
# 2 Green UpArrows - Strength Confirmation Bar with High Close
# Red Square - Failed Strength Signal
# ___Symbols in the Middle of Candles___
# Green Circle - Effort to Move Up
# Magenta Circle - Effort to Move Down
# Yellow Circle - Effort to Move Down on Red Down Candles
# ___Symbols Above Candles___
# White Triangle - Gravestone Doji (included as an experiment as of 20100830 to test its usability in the UpThrust category)
# Yellow Triangle - Weakness
# Orange Circle - No Demand
# Orange Square - PseudoUpThrust
# Orange Triangle - PseudoUpThrust Confirmation
# Red Square - UpThrust
# Red Triangle - Confirmed UpThrust Condition 1
# Red DownArrow - Confirmed UpThrust Condition 2 or 3
# Green Square - Failed UpThrust or PseudoUpThrust Confirmation
# Red Circle - Reversal Likely
# Magenta Square - Distribution
# Magenta Triangle - Two or Three Period UpThrust
#######################################################
# The NT version used a LinRegSlopeSFX indicator for determining trends. Those have been
# replaced in this ToS version with a call to the built in LinearRegressionSlope indicator.
#######
# Arguments
input volumeEMALength = 30;
input narrowSpreadFactor = 0.7;
input wideSpreadFactor = 1.5;
input aboveAvgVolfactor = 1.5;
input ultraHighVolfactor = 2;
input highCloseFactor = 0.70;
input lowCloseFactor = 0.25;
input GdojiFactor = 0.2; # C_RP
input WickFactor = 0.1; # C_RP
input shortTermLength = 5; #C_RP
input midTermLength = 15; #C_RP
input longTermLength = 40; #C_RP
input hwb = 0.0; #C_RP
input colorBars = {false, default true}; #C_RP
input trendText = {false, default true};
input volumeDefinitions = { false, default true };
input alerts = { default false, true };
#######
#C_RP Global Colors
DefineGlobalColor("symbolWhite", Color.WHITE);
#######
# Calculations
rec spread = high - low;
def median = (high + low ) / 2;
rec avgVolume = compoundValue(volumeEMALength, ExpAverage(volume, volumeEMALength), Double.NaN);
# Calculate Volume moving average and it's standard deviation
rec sAvgVolume = compoundValue(volumeEMALength, Average(volume, volumeEMALength), Double.NaN);
def sAvgVolumeSTD = StDev(sAvgVolume, volumeEMALength);
# check if the vloume has been decreasing in the past two days.
def isTwoDaysLowVol = (volume < volume[1] && volume[0] < volume[2]);
# Calculate Range information
def avgSpread = WildersAverage(spread, volumeEMALength)[0];
rec isWideSpreadBar = (spread > (wideSpreadFactor * avgSpread));
rec isNarrowSpreadBar = (spread < (narrowSpreadFactor * avgSpread));
# Price information
rec isUpBar = close > close[1];
rec isDownBar = close < close[1];
# Check if the close is in the Highs/Lows/Middle of the bar.
# C_RP 20100809
# original code - def x1 = if (close == low) then avgSpread else (spread / (close - low));
def x1 = if (high == low) then 2.0 else if (close == low) then 2.65 else (spread / (close - low));
# C_RP try the line below with various divisors totalSum result in a minimum of 2.3 on a spread of 1 pip instead of using a fixed 2.3 as in the line above
# def x1 = if (high==low) then 2.0 else if (close == low) then (spread / 0.43 ) else (spread / (close - low));
def isUpCloseBar = (x1 < 2);
def isDownCloseBar = (x1 > 2);
def isMidCloseBar = (x1 < 2.2 && x1 > 1.8);
def isVeryHighCloseBar = (x1 < 1.35);
# C_RP 20100809 added isVeryLowCloseBar
def isVeryLowCloseBar = (x1 >= 2.65);
# Trend Definitions
rec fiveDaysSma = compoundValue(5, Average(close, 5)[0], Double.NaN);
def LongTermTrendSlope = LinearRegressionSlope(price = fiveDaysSma, length = longTermLength)[0]; # 40
def MiddleTermTrendSlope = LinearRegressionSlope(price = fiveDaysSma, length = midTermLength)[0]; # 15
def ShortTermTrendSlope = LinearRegressionSlope(price = fiveDaysSma, length = shortTermLength)[0]; # 5
######################################################################
# VSA Definitions
# utbar
rec isUpThrustBar = isWideSpreadBar && isDownCloseBar && ShortTermTrendSlope > 0 && MiddleTermTrendSlope > 0; #C_RP added positive middleTermTrendSlope requirement to filter out upThrusts in trends that are only short term. Consider adding longTermTrendSlope requirement as well.
# utcond1
def upThrustConditionOne = (isUpThrustBar[1] && isDownBar);
# utcond2
def upThrustConditionTwo = (isUpThrustBar[1] && isDownBar[0] && volume > volume[1]);
# utcond3
def upThrustConditionThree = (isUpThrustBar[0] && volume > 2 * sAvgVolume[0]);
# scond1
rec isConfirmedUpThrustBar = (upThrustConditionOne or upThrustConditionTwo or upThrustConditionThree);
# scond
rec isNewConfirmedUpThrustBar = (isConfirmedUpThrustBar[0] && !isConfirmedUpThrustBar[1]);
# Two Period UpThrust Bar
rec isTwoPerUpT = isUpBar[1] && isWideSpreadBar[1] && isDownBar[0] && isDownCloseBar[0] && !isUpThrustBar[0] && (AbsValue(open[1] - close[0]) < (GdojiFactor * spread[1])) ;
# Three Period UpThrust Bar
rec isThreePerUpT = isUpBar[2] && isWideSpreadBar[2] && isDownBar[0] && isDownCloseBar[0] && !isUpThrustBar[0] && (AbsValue(open[2] - close[0]) < (GdojiFactor * spread[2])) ;
# C_RP 20100816
# rec isGraveDojiBar = (spread > avgSpread) && (open == low) && (close == low); totally strict Gravestone Doji. Revised version below identifies a candle with above average spread, a real body smaller than 20% of the spread, and a lower wick less than 10% of the spread as a Gravestone Doji pictured as a white triangle above the candle.
rec isGraveDojiBar = (spread > avgSpread) && (AbsValue(open - close) < (GdojiFactor * spread)) && ((AbsValue(close - low) < (WickFactor * spread)) or (AbsValue(open - low) < (WickFactor * spread))); # less strict Gravestone Doji
rec isHammerBar = (spread > avgSpread) && (AbsValue(open - close) < (GdojiFactor * spread)) && ((AbsValue(close - high) < (WickFactor * spread)) or (AbsValue(open - high) < (WickFactor * spread))); # opposite of a less strict Gravestone Doji
# trbar
def reversalLikelyBar = (volume[1] > sAvgVolume[0] && isUpBar[1] && isWideSpreadBar[1] && isDownBar[0] && isDownCloseBar && isWideSpreadBar[0] && LongTermTrendSlope > 0 && high == Highest(high, 10)[0]);
# hutbar
rec isPseudoUpThrustBar = (isUpBar[1] && (volume[1] > aboveAvgVolfactor * sAvgVolume[0]) && isDownBar[0] && isDownCloseBar && !isWideSpreadBar[0] && !isUpThrustBar[0]);
# hutcond
def pseudoUpThrustConfirmation = (isPseudoUpThrustBar[1] && isDownBar[0] && isDownCloseBar && !isUpThrustBar[0]);
# C_RP Failed UpThrustConfirmation or pseudoUpThrustConfirmation occurs when the close of bar following such confirmation is not lower than the close of the confirmation bar
rec isFailedUpThrustConfirmation = (isNewConfirmedUpThrustBar[1] or pseudoUpThrustConfirmation[1]) && close[0] >= close[1];
# tcbar
def weaknessBar = (isUpBar[1] && high[0] == Highest(high, 5)[0] && isDownBar[0] && (isDownCloseBar or isMidCloseBar) && volume[0] > sAvgVolume[0] && !isWideSpreadBar[0] && !isPseudoUpThrustBar[0]);
# stdn, stdn0, stdn1, stdn2
def strengthInDownTrend = (volume[0] > volume[1] && isDownBar[1] && isUpBar[0] && (isUpCloseBar or isMidCloseBar) && ShortTermTrendSlope < 0 && MiddleTermTrendSlope < 0);
def strengthInDownTrend0 = (volume[0] > volume[1] && isDownBar[1] && isUpBar[0] && (isUpCloseBar or isMidCloseBar) && ShortTermTrendSlope < 0 && MiddleTermTrendSlope < 0 && LongTermTrendSlope < 0);
def strengthInDownTrend1 = (volume[0] > (sAvgVolume[0] * aboveAvgVolfactor) && isDownBar[1] && isUpBar[0] && (isUpCloseBar or isMidCloseBar) && ShortTermTrendSlope < 0 && MiddleTermTrendSlope < 0 && LongTermTrendSlope < 0);
def strengthInDownTrend2 = (volume[1] < sAvgVolume[0] && isUpBar[0] && isVeryHighCloseBar && volume[0] > sAvgVolume[0] && ShortTermTrendSlope < 0);
rec bycond1 = (strengthInDownTrend or strengthInDownTrend1);
# bycond
def isStrengthConfirmationBar = (isUpBar[0] && bycond1[1]);
# bycond2 C_RP UpClose on higher volume with all slopes down adds extra strength
def isStrengthConfirmationBar2 = (isUpBar[0] && isUpCloseBar[0] && volume[0] > volume[1] && LongTermTrendSlope < 0 && bycond1[1]);
# Failed strength in downtrend signal force a follow-up bar that closes below mid-point of confirmaton bar C_RP
def isFailedStrengthSignal = (isStrengthConfirmationBar[1] or isStrengthConfirmationBar2[1] or strengthInDownTrend2[1]) && close[0] <= (close[1] - (spread[1] / 2));
# stvol
def stopVolBar = low[0] == Lowest(low, 5)[0] && (isUpCloseBar or isMidCloseBar) && volume[0] > aboveAvgVolfactor * sAvgVolume[0] && LongTermTrendSlope < 0;
# C_RP stvol at highs - the opposite of stvol
def stopVolBarHighs = high[0] == Highest(high, 5)[0] && (isDownCloseBar or isMidCloseBar) && volume[0] > aboveAvgVolfactor * sAvgVolume[0] && LongTermTrendSlope > 0;
# ndbar, nsbar
def noDemandBar = (isUpBar[0] && isNarrowSpreadBar[0] && isTwoDaysLowVol && isDownCloseBar);
# C_RP 20100809
# def noSupplyBar = (isDownBar[0] && isNarrowSpreadBar[0] && isTwoDaysLowVol && isDownCloseBar);
def noSupplyBar = (isDownBar[0] && isNarrowSpreadBar[0] && isTwoDaysLowVol && isUpCloseBar);
# lvtbar, lvtbar1, lvtbar2
rec supplyTestBar = (isTwoDaysLowVol && low[0] < low[1] && isUpCloseBar);
def supplyTestInUpTrendBar = (volume[0] < sAvgVolume[0] && low[0] < low[1] && isUpCloseBar && LongTermTrendSlope > 0 && MiddleTermTrendSlope > 0 && isWideSpreadBar[0]);
def successfulSupplyTestBar = (supplyTestBar[1] && isUpBar[0] && isUpCloseBar);
def successfulSupplyTestBar2 = (successfulSupplyTestBar[1] && isUpBar[0] && x1 <= 2 && volume[0] > volume[1]); # C_RP x1 finds Mid and UpCloseBars
# dbar
def distributionBar = (volume[0] > ultraHighVolfactor * sAvgVolume[0] && isDownCloseBar && isUpBar[0] && ShortTermTrendSlope > 0 && MiddleTermTrendSlope > 0 && !isConfirmedUpThrustBar[0] && !isUpThrustBar[0]);
# eftup, eftupfl, eftdn
def effortToMoveUpBar = (high[0] > high[1] && low[0] > low[1] && close[0] > close[1] && close[0] >= ((high[0] - low[0]) * highCloseFactor + low[0]) && spread[0] > avgSpread && volume[0] > volume[1]);
def failedEffortUpMove = (effortToMoveUpBar[1] && (isUpThrustBar[0] or upThrustConditionOne or upThrustConditionTwo or upThrustConditionThree));
def effortToMoveDownBar = ( ((high[0] < high[1]) or (isWideSpreadBar && volume[0] > 1.5 * sAvgVolume[0])) && low[0] < low[1] && close[0] < close[1] && close[0] <= ((high[0] - low[0]) * lowCloseFactor + low[0]) && spread[0] > avgSpread && volume[0] > volume[1]);
#C_RP old code - def effortToMoveDownBar = (high[0] < high[1] && low[0] < low[1] && close[0] < close[1] && Close[0] <= ((high[0] - low[0]) * lowCloseFactor + low[0]) && spread[0] > avgSpread && volume[0] > volume[1]);
def hwbReaction = (hwb != 0.0) ; #C_RP
######################################################################
# set the shapes on the graph
# hwbReaction - cyan arrow on bottom for longs. If input hwb = 0 then hwbReactionis false and plot does not draw.
plot hwbReactionPlot = if hwbReaction then (low - 7 * TickSize()) else Double.NaN;
hwbReactionPlot.SetPaintingStrategy(PaintingStrategy.ARROW_UP);
hwbReactionPlot.SetDefaultColor(Color.CYAN);
hwbReactionPlot.HideBubble();
hwbReactionPlot.HideTitle();
# upthurst and NOT confirmed - red square on top
plot upThrustBarPlot = if isUpThrustBar[0] and !isNewConfirmedUpThrustBar[0] then (high + 2 * TickSize()) else Double.NaN;
upThrustBarPlot.SetPaintingStrategy(PaintingStrategy.LINE_VS_SQUARES);
upThrustBarPlot.SetStyle(Curve.POINTS);
upThrustBarPlot.SetDefaultColor(Color.RED);
upThrustBarPlot.HideBubble();
upThrustBarPlot.HideTitle();
# C_RP 20100816
# any instance of a Gravestone Doji - white triangle on top
plot GraveDojiBarPlot = if isGraveDojiBar[0] then (high + 4 * TickSize()) else Double.NaN;
GraveDojiBarPlot.SetPaintingStrategy(PaintingStrategy.LINE_VS_TRIANGLES);
GraveDojiBarPlot.SetStyle(Curve.POINTS);
GraveDojiBarPlot.SetDefaultColor(CreateColor(255, 255, 255));
GraveDojiBarPlot.HideBubble();
GraveDojiBarPlot.HideTitle();
# C_RP 20100816
# any instance of a Gravestone Doji - white triangle on top
plot HammerBarPlot = if isHammerBar[0] then (low - 4 * TickSize()) else Double.NaN;
HammerBarPlot.SetPaintingStrategy(PaintingStrategy.LINE_VS_TRIANGLES);
HammerBarPlot.SetStyle(Curve.POINTS);
HammerBarPlot.SetDefaultColor(CreateColor(255, 255, 255));
HammerBarPlot.HideBubble();
HammerBarPlot.HideTitle();
# C_RP
# Two Period UpThrust Plot - magenta triangle high on top
plot TwoPerUpTPlot = if isTwoPerUpT[0] then (high + 4 * TickSize()) else Double.NaN;
TwoPerUpTPlot.SetPaintingStrategy(PaintingStrategy.LINE_VS_TRIANGLES);
TwoPerUpTPlot.SetStyle(Curve.POINTS);
TwoPerUpTPlot.SetDefaultColor(Color.MAGENTA);
TwoPerUpTPlot.HideBubble();
TwoPerUpTPlot.HideTitle();
# C_RP
# Three Period UpThrust Plot - magenta triangle high on top
plot ThreePerUpTPlot = if isThreePerUpT[0] then (high + 4 * TickSize()) else Double.NaN;
ThreePerUpTPlot.SetPaintingStrategy(PaintingStrategy.LINE_VS_TRIANGLES);
ThreePerUpTPlot.SetStyle(Curve.POINTS);
ThreePerUpTPlot.SetDefaultColor(Color.MAGENTA);
ThreePerUpTPlot.HideBubble();
ThreePerUpTPlot.HideTitle();
# reversal likely - blue diamond on top C_RP red 6 * ticksize
plot reversalLikelyBarPlot = if reversalLikelyBar then (high + 6 * TickSize()) else Double.NaN;
reversalLikelyBarPlot.SetPaintingStrategy(PaintingStrategy.POINTS);
reversalLikelyBarPlot.SetDefaultColor(Color.RED);
reversalLikelyBarPlot.HideBubble();
reversalLikelyBarPlot.HideTitle();
# new confirmed upthrust bar - red triangle (down) on top C_RP for upThrustConditionOne only
plot isNewConfirmedUpThrustBarPlot = if isNewConfirmedUpThrustBar && upThrustConditionOne then (high + 2 * TickSize()) else Double.NaN;
isNewConfirmedUpThrustBarPlot.SetPaintingStrategy(PaintingStrategy.LINE_VS_TRIANGLES);
isNewConfirmedUpThrustBarPlot.SetDefaultColor(Color.RED);
isNewConfirmedUpThrustBarPlot.HideBubble();
isNewConfirmedUpThrustBarPlot.HideTitle();
# new confirmed upthrust bar - red triangle (down) on top C_RP red arrow down at 4 * tickSize for conditions 2 and 3
plot isNewConfirmedUpThrustBarPlot23 = if isNewConfirmedUpThrustBar && (upThrustConditionTwo or upThrustConditionThree) then (high + 4 * TickSize()) else Double.NaN;
isNewConfirmedUpThrustBarPlot23.SetPaintingStrategy(PaintingStrategy.ARROW_DOWN);
isNewConfirmedUpThrustBarPlot23.SetDefaultColor(Color.RED);
isNewConfirmedUpThrustBarPlot23.HideBubble();
isNewConfirmedUpThrustBarPlot23.HideTitle();
# strength in down trend - lime square on bottom C_RP cyan for weakest strengthInDownTrend
plot strengthInDownTrendPlot = if strengthInDownTrend then (low - 4 * TickSize()) else Double.NaN;
strengthInDownTrendPlot.SetPaintingStrategy(PaintingStrategy.LINE_VS_SQUARES);
strengthInDownTrendPlot.SetDefaultColor(Color.CYAN);
strengthInDownTrendPlot.HideBubble();
strengthInDownTrendPlot.HideTitle();
# strength in down trend - lime square on bottom C_RP for next-to-weakest strengthInDownTrend
plot strengthInDownTrend1Plot = if strengthInDownTrend1 then (low - 4 * TickSize()) else Double.NaN;
strengthInDownTrend1Plot.SetPaintingStrategy(PaintingStrategy.LINE_VS_SQUARES);
strengthInDownTrend1Plot.SetDefaultColor(Color.GREEN);
strengthInDownTrend1Plot.HideBubble();
strengthInDownTrend1Plot.HideTitle();
# supply test in up trend - lime square on bottom of the bar C_RP grey
plot supplyTestInUpTrendBarPlot = if supplyTestInUpTrendBar then (low - 4 * TickSize()) else Double.NaN;
supplyTestInUpTrendBarPlot.SetPaintingStrategy(PaintingStrategy.LINE_VS_SQUARES);
supplyTestInUpTrendBarPlot.SetDefaultColor(CreateColor(153, 153, 153));
supplyTestInUpTrendBarPlot.HideBubble();
supplyTestInUpTrendBarPlot.HideTitle();
# successful test for supply - yellow triangle up on bottom of the bar C_RP cyan
plot successfulSupplyTestBarPlot = if successfulSupplyTestBar or successfulSupplyTestBar2 then (low - 2 * TickSize()) else Double.NaN;
successfulSupplyTestBarPlot.SetPaintingStrategy(PaintingStrategy.LINE_VS_TRIANGLES);
successfulSupplyTestBarPlot.SetDefaultColor(Color.CYAN);
successfulSupplyTestBarPlot.HideBubble();
successfulSupplyTestBarPlot.HideTitle();
# successful test for supply - yellow triangle up on bottom of the bar C_RP cyan double triangle for strong follow-up bar
plot successfulSupplyTestBarPlot2 = if successfulSupplyTestBar2 then (low - 4 * TickSize()) else Double.NaN;
successfulSupplyTestBarPlot2.SetPaintingStrategy(PaintingStrategy.LINE_VS_TRIANGLES);
successfulSupplyTestBarPlot2.SetDefaultColor(Color.CYAN);
successfulSupplyTestBarPlot2.HideBubble();
successfulSupplyTestBarPlot2.HideTitle();
# stopping volume green (diamond) circle at bottom of bar
plot stopVolBarPlot = if stopVolBar then (low - 2 * TickSize()) else Double.NaN;
stopVolBarPlot.SetPaintingStrategy(PaintingStrategy.LINE_VS_POINTS);
stopVolBarPlot.SetDefaultColor(Color.GREEN);
stopVolBarPlot.HideBubble();
stopVolBarPlot.HideTitle();
# stopping volume yellow (diamond) circle at top of bar
plot stopVolBarHighsPlot = if stopVolBarHighs then (high + 7 * TickSize()) else Double.NaN;
stopVolBarHighsPlot.SetPaintingStrategy(PaintingStrategy.LINE_VS_POINTS);
stopVolBarHighsPlot.SetDefaultColor(Color.YELLOW);
stopVolBarHighsPlot.HideBubble();
stopVolBarHighsPlot.HideTitle();
# green triangle up at bottom of the bar C_RP Green arrow up 4 * tickSize for strong strength_In_DownTrend
plot isStrengthConfirmationBarPlot = if isStrengthConfirmationBar then (low - 4 * TickSize()) else Double.NaN;
isStrengthConfirmationBarPlot.SetPaintingStrategy(PaintingStrategy.ARROW_UP);
isStrengthConfirmationBarPlot.SetDefaultColor(Color.GREEN);
isStrengthConfirmationBarPlot.HideBubble();
isStrengthConfirmationBarPlot.HideTitle();
# green triangle up at bottom of the bar C_RP Green arrow up 7 * tickSize for strongest strength_In_DownTrend with isUpCloseBar
plot isStrengthConfirmationBarPlot2 = if isStrengthConfirmationBar2 then (low - 7 * TickSize()) else Double.NaN;
isStrengthConfirmationBarPlot2.SetPaintingStrategy(PaintingStrategy.ARROW_UP);
isStrengthConfirmationBarPlot2.SetDefaultColor(Color.GREEN);
isStrengthConfirmationBarPlot2.HideBubble();
isStrengthConfirmationBarPlot2.HideTitle();
# blue square at top of bar C_RP orange
plot isPseudoUpThrustBarPlot = if isPseudoUpThrustBar then (high + 2 * TickSize()) else Double.NaN;
isPseudoUpThrustBarPlot.SetPaintingStrategy(PaintingStrategy.LINE_VS_SQUARES);
isPseudoUpThrustBarPlot.SetDefaultColor(CreateColor(255, 102, 102));
isPseudoUpThrustBarPlot.HideBubble();
isPseudoUpThrustBarPlot.HideTitle();
# blue triangle (down) at top of bar C_RP orange
plot pseudoUpThrustConfirmationPlot = if pseudoUpThrustConfirmation then (high + 2 * TickSize()) else Double.NaN;
pseudoUpThrustConfirmationPlot.SetPaintingStrategy(PaintingStrategy.LINE_VS_TRIANGLES);
pseudoUpThrustConfirmationPlot.SetDefaultColor(CreateColor(255, 102, 102));
pseudoUpThrustConfirmationPlot.HideBubble();
pseudoUpThrustConfirmationPlot.HideTitle();
# Failed UpthrustBarPlot Confirmation plots a green square 2 * tickSize above the failed bar C_RP
plot FailedUpThrustConfirmationPlot = if isFailedUpThrustConfirmation then (high + 2 * TickSize()) else Double.NaN;
FailedUpThrustConfirmationPlot.SetPaintingStrategy(PaintingStrategy.LINE_VS_SQUARES);
FailedUpThrustConfirmationPlot.SetDefaultColor(Color.GREEN);
FailedUpThrustConfirmationPlot.HideBubble();
FailedUpThrustConfirmationPlot.HideTitle();
# yellow triangle (down) at top of bar
plot weaknessBarPlot = if weaknessBar then (high + 2 * TickSize()) else Double.NaN;
weaknessBarPlot.SetPaintingStrategy(PaintingStrategy.LINE_VS_TRIANGLES);
weaknessBarPlot.SetDefaultColor(Color.YELLOW);
weaknessBarPlot.HideBubble();
weaknessBarPlot.HideTitle();
# aqua triangle up at bottom of bar C_RP green triangle for next-to-strongest strengthInDownTrend
plot strengthInDownTrend2Plot = if strengthInDownTrend2 then (low - 2 * TickSize()) else Double.NaN;
strengthInDownTrend2Plot.SetPaintingStrategy(PaintingStrategy.LINE_VS_TRIANGLES);
strengthInDownTrend2Plot.SetDefaultColor(Color.GREEN); # ????
strengthInDownTrend2Plot.HideBubble();
strengthInDownTrend2Plot.HideTitle();
# Failed strength in downtrend signal plots red square at candle's bottom. Under rare conditions a strengthinDownTrend2 green triangle can be overwritten by a successfulsupplyTest cyan triangle below the previous bar. If the bar following the cyan triangle is a FailedStrengthSignal a red square will be plotted on the following bar which is a desirable artifact of this coincidence.
plot failedstrengthsignalPlot = if isFailedStrengthSignal then (low - 2 * TickSize()) else Double.NaN;
failedstrengthsignalPlot.SetPaintingStrategy(PaintingStrategy.LINE_VS_SQUARES);
failedstrengthsignalPlot.SetDefaultColor(Color.RED);
failedstrengthsignalPlot.HideBubble();
failedstrengthsignalPlot.HideTitle();
# distribution at end of uptrend - blue square on top C_RP magenta
plot distributionBarPlot = if distributionBar then (high + 2 * TickSize()) else Double.NaN;
distributionBarPlot.SetPaintingStrategy(PaintingStrategy.LINE_VS_SQUARES);
distributionBarPlot.SetDefaultColor (Color.MAGENTA);
distributionBarPlot.HideBubble();
distributionBarPlot.HideTitle();
# supply test bar - pink square on bottom C_RP white
plot supplyTestBarPlot = if supplyTestBar then (low - 2 * TickSize()) else Double.NaN;
supplyTestBarPlot.SetPaintingStrategy(PaintingStrategy.LINE_VS_SQUARES);
supplyTestBarPlot.SetDefaultColor(GlobalColor("symbolWhite");
supplyTestBarPlot.HideBubble();
supplyTestBarPlot.HideTitle();
# no demand bar - blue squre on top C_RP orange circle
plot noDemandBarPlot = if noDemandBar then (high + 2 * TickSize()) else Double.NaN;
noDemandBarPlot.SetPaintingStrategy(PaintingStrategy.LINE_VS_POINTS);
noDemandBarPlot.SetDefaultColor(CreateColor(255, 102, 102));
noDemandBarPlot.HideBubble();
noDemandBarPlot.HideTitle();
# no supply bar - lime diamond on bottom C_RP turquoise
plot noSupplyBarPlot = if noSupplyBar then (low - 2 * TickSize()) else Double.NaN;
noSupplyBarPlot.SetPaintingStrategy(PaintingStrategy.LINE_VS_POINTS);
noSupplyBarPlot.SetDefaultColor (Color.CYAN);
noSupplyBarPlot.HideBubble();
noSupplyBarPlot.HideTitle();
# effort to move up - turquoise diamond in the median of the bar C_RP green
plot effortToMoveUpBarPlot = if effortToMoveUpBar then (median) else Double.NaN;
effortToMoveUpBarPlot.SetPaintingStrategy(PaintingStrategy.LINE_VS_POINTS);
effortToMoveUpBarPlot.SetDefaultColor(CreateColor(0, 255, 0));
effortToMoveUpBarPlot.HideBubble();
effortToMoveUpBarPlot.HideTitle();
# effort to move down - yellow diamond in the median of the bar C_RP for all except red bars the circle's color is magenta
plot effortToMoveDownBarPlot = if effortToMoveDownBar && !(ShortTermTrendSlope < 0 && MiddleTermTrendSlope < 0 && LongTermTrendSlope < 0) then (median) else Double.NaN;
effortToMoveDownBarPlot.SetPaintingStrategy(PaintingStrategy.LINE_VS_POINTS);
effortToMoveDownBarPlot.SetDefaultColor(Color.MAGENTA);
effortToMoveDownBarPlot.HideBubble();
effortToMoveDownBarPlot.HideTitle();
# effort to move down - yellow diamond in the median of the bar C_RP yellow circle for Red bars
plot effortToMoveDownBarPlotYel = if effortToMoveDownBar && ShortTermTrendSlope < 0 && MiddleTermTrendSlope < 0 && LongTermTrendSlope < 0 then (median) else Double.NaN;
effortToMoveDownBarPlotYel.SetPaintingStrategy(PaintingStrategy.LINE_VS_POINTS);
effortToMoveDownBarPlotYel.SetDefaultColor(Color.YELLOW);
effortToMoveDownBarPlotYel.HideBubble();
effortToMoveDownBarPlotYel.HideTitle();
######
# Candle definitions
AssignPriceColor( if colorBars and ShortTermTrendSlope > 0 and MiddleTermTrendSlope > 0 and LongTermTrendSlope > 0 then CreateColor(0, 255, 0) # UUU Green
else if colorBars and ShortTermTrendSlope > 0 and MiddleTermTrendSlope > 0 and LongTermTrendSlope < 0 then CreateColor(153, 255, 102) # UUD Lime Green
else if colorBars and ShortTermTrendSlope > 0 and MiddleTermTrendSlope < 0 and LongTermTrendSlope < 0 then CreateColor(153, 255, 255) # UDD Light Cyan
else if colorBars and ShortTermTrendSlope < 0 and MiddleTermTrendSlope < 0 and LongTermTrendSlope < 0 then Color.RED # DDD Red
else if colorBars and ShortTermTrendSlope < 0 and MiddleTermTrendSlope > 0 and LongTermTrendSlope > 0 then Color.ORANGE # DUU Orange
else if colorBars and ShortTermTrendSlope < 0 and MiddleTermTrendSlope < 0 and LongTermTrendSlope > 0 then Color.ORANGE # DDU Orange
else if colorBars then CreateColor(153, 153, 153) else Color.CURRENT); # all other combinations are Light Gray
#######
# Trend Text Definitions
# some colors changed to match symbols with text backgrounds
AddLabel(trendText, Concat("Vol: ", if volume > sAvgVolume[0] + 2.0 * sAvgVolumeSTD then "VH"
else if volume[0] > (sAvgVolume[0] + 1.0 * sAvgVolumeSTD) then "H"
else if (volume[0] > sAvgVolume[0]) then ">Avg"
else if (volume[0] < sAvgVolume[0] && volume[0] > (sAvgVolume[0] - 1.0 * sAvgVolumeSTD)) then "<Avg"
else if (volume[0] < (sAvgVolume[0] - 1.0 * sAvgVolumeSTD)) then "L"
else "", Color.WHITE);
AddLabel(trendText, Concat("Spr: ", if (spread > (avgSpread * 2.0)) then "W"
else if (spread > avgSpread) then ">Avg"
else "N", Color.WHITE);
# C_RP 20100809 added isVeryLowCloseBar and changed execution order so that both Verys and Mid execute first
AddLabel(trendText, Concat("Cls: ", if (isVeryHighCloseBar) then "VH"
else if (isVeryLowCloseBar) then "VL"
else if (isMidCloseBar) then "M"
else if (isUpCloseBar) then "H"
else if (isDownCloseBar) then "D"
else "NC", Color.WHITE);
AddLabel(trendText, Concat("Trd: ", Concat("St-", if (ShortTermTrendSlope > 0) then "U"
else "D"), Color.WHITE);
AddLabel(trendText, Concat("Mt-", if (MiddleTermTrendSlope > 0) then "U" else "D", Color.WHITE);
AddLabel(trendText, Concat("Lt-", if (LongTermTrendSlope > 0) then "U" else "D", Color.WHITE);
######
# Volume Bar Definitions
AddLabel(volumeDefinitions, if isUpThrustBar[0] then "Weakness on UpThrust" #C_RP Red Square
else if upThrustConditionOne then "Weakness confirmed on Downbar after UpThrust" #C_RP Red Triangle
else if upThrustConditionTwo && !upThrustConditionOne then "Weakness confirmed on High-volume Downbar after UpThrust" #C_RP Red DownArrow
else if upThrustConditionThree then "Weakness confirmed on High-volume UpThrust" #C_RP Red DownArrow
else if isTwoPerUpT then "Weakness on 2-period UpThrust" #C_RP Magenta Triangle
else if isThreePerUpT then "Weakness on 3-period UpThrust" #C_RP Magenta Triangle
else if isGraveDojiBar then "Reversal possible on Gravestone Doji" #C_RP White Triangle
else if isHammerBar then "Reversal possible on Hammer Doji" #C_RP White Triangle
else if strengthInDownTrend then "Strength returning in Downtrend" #C_RP Cyan Square
else if strengthInDownTrend0 then "Strength returning in long Downtrend" #C_RP Cyan Square
else if strengthInDownTrend1 then "Strength returning on High Volume in Downtrend" #C_RP Green Square
else if strengthInDownTrend2 then "Strength on High-volume UpBar closing on High" #C_RP Green Triangle
else if supplyTestBar[0] then "Test for Supply" #C_RP White Square
else if successfulSupplyTestBar[0] then "Strength confirmed on UpBar closing Near High after Test" #C_RP Cyan Triangle
else if isStrengthConfirmationBar then "Strength confirmed on UpBar" #C_RP Green UpArrow
else if isStrengthConfirmationBar2 then "Strength confirmed on UpBar closing Near High" #C_RP Two Green UpArrows
else if isFailedStrengthSignal then "Bearish on Failed Strength Confirmation in downtrend" #C_RP Red Square
else if distributionBar then "Distribution on High-volume UpBar closing Down in Uptrend" #C_RP Magenta Square
else if isPseudoUpThrustBar[0] then "Weakness on Pseudo-UpThrust." #C_RP Orange Square
else if pseudoUpThrustConfirmation then "Weakness confirmed on DownBar closing Down after PseudoUpThrust" #C_RP Orange Triangle
else if isFailedUpThrustConfirmation then "Less Bearish on Failed UpThrust Confirmation" #C_RP Green Square
else if supplyTestInUpTrendBar then "Test for Supply in Uptrend" #C_RP Gray Square
else if weaknessBar then "Weakness on High-volume DownBar after High-volume UpMove" #C_RP Yellow Triangle
else if noDemandBar then "Weakness on No Demand" #C_RP Orange Circle
else if noSupplyBar then "Strength on No Supply" #C_RP Cyan Circle
else if effortToMoveUpBar[0] then "Bullish on Effort-to-Rise" #C_RP Green Circle on middle of Bar
else if effortToMoveDownBar then "Bearish on Effort-to-Fall" #C_RP Magenta or Yellow Circle on middle of Bar
else if failedEffortUpMove then "Bearish on Failed Effort-to-Rise" #C_RP no symbol for this indication
else if stopVolBar then "Stopping Volume at Lows indicates Downtrend end likely" #C_RP Green Circle
else if stopVolBarHighs then "Stopping Volume at Highs indicates Uptrend end likely" #C_RP Yellow Circle
else "",
if isUpThrustBar[0] then Color.RED
else if upThrustConditionOne then Color.RED
else if upThrustConditionTwo && !upThrustConditionOne then Color.RED
else if upThrustConditionThree then Color.RED
else if isTwoPerUpT then Color.MAGENTA
else if isThreePerUpT then Color.MAGENTA
else if isGraveDojiBar or isHammerBar then CreateColor(255, 255, 255)
else if strengthInDownTrend1 then Color.GREEN
else if strengthInDownTrend0 && !strengthInDownTrend then Color.CYAN
else if strengthInDownTrend && !strengthInDownTrend1 then Color.CYAN
else if isFailedStrengthSignal then Color.RED
else if supplyTestBar[0] then GlobalColor("symbolWhite"
else if successfulSupplyTestBar[0] then CreateColor(102, 255, 0)
else if isStrengthConfirmationBar then Color.GREEN
else if distributionBar then Color.MAGENTA
else if isPseudoUpThrustBar[0] then (CreateColor(255, 102, 102))
else if pseudoUpThrustConfirmation then (CreateColor(255, 102, 102))
else if isFailedUpThrustConfirmation then (Color.GREEN)
else if supplyTestInUpTrendBar then CreateColor(153, 153, 153)
else if strengthInDownTrend2 then Color.GREEN
else if weaknessBar then Color.ORANGE
else if noDemandBar then CreateColor(255, 102, 102)
else if noSupplyBar then Color.CYAN
else if effortToMoveUpBar[0] then CreateColor(0, 255, 0)
else if effortToMoveDownBar then Color.MAGENTA
else if failedEffortUpMove then Color.BLUE
else if stopVolBar then Color.GREEN
else if stopVolBarHighs then Color.YELLOW
else Color.BLACK);
########
# Alerts
Alert(if alerts and (isUpThrustBar[0]
or upThrustConditionOne
or (upThrustConditionTwo && !upThrustConditionOne)
or upThrustConditionThree
or strengthInDownTrend1
or (strengthInDownTrend0 && !strengthInDownTrend)
or (strengthInDownTrend && !strengthInDownTrend1)
or supplyTestBar[0]
or successfulSupplyTestBar[0]
or isStrengthConfirmationBar
or distributionBar
or isPseudoUpThrustBar[0]
or pseudoUpThrustConfirmation
or supplyTestInUpTrendBar
or strengthInDownTrend2
or weaknessBar
or noDemandBar
or noSupplyBar
or effortToMoveUpBar[0]
or effortToMoveDownBar
or failedEffortUpMove
or stopVolBar) then 1 else 0, if isUpThrustBar[0] then "An Upthrust Bar. A sign of weakness."
else if upThrustConditionOne then "A downbar after an Upthrust. Confirm weakness."
else if upThrustConditionTwo && !upThrustConditionOne then "A High Volume downbar after an Upthrust. Confirm weakness."
else if upThrustConditionThree then "This upthrust at very High Volume, Confirms weakness."
else if strengthInDownTrend1 then "Strength seen returning after a down trend. High volume adds to strength. "
else if strengthInDownTrend0 && !strengthInDownTrend then "Strength seen returning after a down trend."
else if strengthInDownTrend && !strengthInDownTrend1 then "Strength seen returning after a long down trend."
else if supplyTestBar[0] then "Test for supply."
else if successfulSupplyTestBar[0] then "An Upbar closing near High after a Test confirms strength."
else if isStrengthConfirmationBar then "An Upbar closing near High. Confirms return of Strength."
else if distributionBar then "A High Volume Up Bar closing down in a uptrend shows Distribution."
else if isPseudoUpThrustBar[0] then "Psuedo UpThrust. A Sign of Weakness."
else if pseudoUpThrustConfirmation then "A Down Bar closing down after a Pseudo Upthrust confirms weakness."
else if supplyTestInUpTrendBar then "Test for supply in a uptrend. Sign of Strength."
else if strengthInDownTrend2 then "High volume upbar closing on the high indicates strength."
else if weaknessBar then "High volume Downbar after an upmove on high volume indicates weakness."
else if noDemandBar then "No Demand. A sign of Weakness."
else if noSupplyBar then "No Supply. A sign of Strength."
else if effortToMoveUpBar[0] then "Effort to Rise. Bullish sign."
else if effortToMoveDownBar then "Effort to Fall. Bearish sign."
else if failedEffortUpMove then "Effort to Move up has failed. Bearish sign."
else if stopVolBar then "Stopping volume. Normally indicates end of bearishness is nearing."
else "", Alert.BAR, Sound.Ding);
# Red Square - UpThrust bar.
# Blue Diamond - Reversal possible, yesterday was high volume wide spread up bar, but
# today we reached 10 days high with low close wide spread down bar.
# Red Triangle Down - UpThrust confirmation.
# Lime Square - Strength bar (either strength is showing in down trend or a supply
# test in up trend).
# Yellow Triangle Up - An Upbar closing near High after a Test confirms strength.
# Lime Diamond - Stopping volume. Normally indicates end of bearishness is nearing
# /OR/ No supply.
# Lime Triangle Up - The previous bar saw strength coming back, This upbar confirms strength.
# Blue Square - Psuedo UpThrust, A Sign of Weakness /OR/ A High Volume Up Bar closing
# down in a uptrend shows Distribution /OR/ No Demand.
# Blue Triangle Down - A Down Bar closing down after a Pseudo Upthrust confirms weakness.
# Yellow Triangle Down - High volume Downbar after an upmove on high volume indicates weakness.
# Aqua Triangle Up - High volume upbar closing on the high indicates strength (in short
# term down trend).
# Deep Pink Square - Test for supply.
# Turquoise Diamond - Effort to Rise. Bullish sign.
# Yellow Diamond - Effort to Fall. Bearish sign.
I don't want to do away with any of the study, just move it to a subgraph below. I'm trying to figure out how to buy you that cup of coffee as I read somewhere else on this site. I take it that's done through paypal?
Any help is appreciated sir.
Dan
I love the following script which is called volume spread analysis. It gives cues to strength and weakness with dots and what not.
It also colors the price bars red when price is nearing a turn around at the lows and Green when it reaches the High. However, those colors override the red and green of the regular chart showing when price moved up or down for that bar. Do you think you could strip out the color coding of the price bars and provide me with the ability to represent it as a volume sub graph with the volume bars colored in the same fashion?
# VSA Script
#In addition, a symbol's shape and its vertical position above or below a candle now imparts added meaning to it. In general, the strength of a symbol is assigned by its color and shape in that order. In certain circumstances a symbol's vertical offset from its candle's top or bottom strengthens the symbol's meaning. The symbol strength hierarchy is defined as follows:
# 1. Color: Symbols below candles are assigned strength from weakest to strongest in this order: white (or grey), cyan (blue/green), green. A red symbol under a candle indicates the failure of the symbol attached below the candle immediately preceding it.
# Symbols above candles are assigned strength from weakest to strongest in this order: yellow, orange, red. A green symbol above a candle indicates the failure of a symbol attached above the candle immediately preceding it. A magenta (pinkish purple) square above a candle is a special case indicating Distribution. Another special case for testing purposes as of 20100830 is a white triangle high above a candle indicating a Gravestone Doji.
# Symbols drawn on the middle of a candle are of two types with one variation. A green circle indicates Effort to Move Up on up bars. A magenta (pinkish purple) circle indicates Effort to Move Down on down bars except for red down bars on which magenta displays poorly. In order to be seen easily, yellow circles indicate Effort to Move Down on red down bars.
# 2. Shape: A symbol of a given color is assigned increasing strength according to this hierarchy (from low to high): circle, square, triangle, downward or upward arrow. In certain circumstances two symbols of the same shape and color will be stacked vertically, adding strength through the combined symbols. Occasionally, two different symbols will be stacked vertically because that candle satisfies the criteria for two indications.
# Listed below are the symbols and their meanings. The original symbol chart can be found at the end of this study.
# ___Symbols Below Candles___
# White Square - Test for Supply
# Cyan Circle - No Supply
# Cyan Triangle - Successful Test for Supply
# 2 Cyan Triangles - Successful Test for Supply 2
# Grey Square - Test for Supply in Uptrend
# Green Circle - Stopping Volume
# Cyan Square - Strength in Downtrend
# Green Square - Strength in Downtrend 1
# Green Triangle - Strength in Downtrend 2
# Green UpArrow - Strength Confirmation Bar
# 2 Green UpArrows - Strength Confirmation Bar with High Close
# Red Square - Failed Strength Signal
# ___Symbols in the Middle of Candles___
# Green Circle - Effort to Move Up
# Magenta Circle - Effort to Move Down
# Yellow Circle - Effort to Move Down on Red Down Candles
# ___Symbols Above Candles___
# White Triangle - Gravestone Doji (included as an experiment as of 20100830 to test its usability in the UpThrust category)
# Yellow Triangle - Weakness
# Orange Circle - No Demand
# Orange Square - PseudoUpThrust
# Orange Triangle - PseudoUpThrust Confirmation
# Red Square - UpThrust
# Red Triangle - Confirmed UpThrust Condition 1
# Red DownArrow - Confirmed UpThrust Condition 2 or 3
# Green Square - Failed UpThrust or PseudoUpThrust Confirmation
# Red Circle - Reversal Likely
# Magenta Square - Distribution
# Magenta Triangle - Two or Three Period UpThrust
#######################################################
# The NT version used a LinRegSlopeSFX indicator for determining trends. Those have been
# replaced in this ToS version with a call to the built in LinearRegressionSlope indicator.
#######
# Arguments
input volumeEMALength = 30;
input narrowSpreadFactor = 0.7;
input wideSpreadFactor = 1.5;
input aboveAvgVolfactor = 1.5;
input ultraHighVolfactor = 2;
input highCloseFactor = 0.70;
input lowCloseFactor = 0.25;
input GdojiFactor = 0.2; # C_RP
input WickFactor = 0.1; # C_RP
input shortTermLength = 5; #C_RP
input midTermLength = 15; #C_RP
input longTermLength = 40; #C_RP
input hwb = 0.0; #C_RP
input colorBars = {false, default true}; #C_RP
input trendText = {false, default true};
input volumeDefinitions = { false, default true };
input alerts = { default false, true };
#######
#C_RP Global Colors
DefineGlobalColor("symbolWhite", Color.WHITE);
#######
# Calculations
rec spread = high - low;
def median = (high + low ) / 2;
rec avgVolume = compoundValue(volumeEMALength, ExpAverage(volume, volumeEMALength), Double.NaN);
# Calculate Volume moving average and it's standard deviation
rec sAvgVolume = compoundValue(volumeEMALength, Average(volume, volumeEMALength), Double.NaN);
def sAvgVolumeSTD = StDev(sAvgVolume, volumeEMALength);
# check if the vloume has been decreasing in the past two days.
def isTwoDaysLowVol = (volume < volume[1] && volume[0] < volume[2]);
# Calculate Range information
def avgSpread = WildersAverage(spread, volumeEMALength)[0];
rec isWideSpreadBar = (spread > (wideSpreadFactor * avgSpread));
rec isNarrowSpreadBar = (spread < (narrowSpreadFactor * avgSpread));
# Price information
rec isUpBar = close > close[1];
rec isDownBar = close < close[1];
# Check if the close is in the Highs/Lows/Middle of the bar.
# C_RP 20100809
# original code - def x1 = if (close == low) then avgSpread else (spread / (close - low));
def x1 = if (high == low) then 2.0 else if (close == low) then 2.65 else (spread / (close - low));
# C_RP try the line below with various divisors totalSum result in a minimum of 2.3 on a spread of 1 pip instead of using a fixed 2.3 as in the line above
# def x1 = if (high==low) then 2.0 else if (close == low) then (spread / 0.43 ) else (spread / (close - low));
def isUpCloseBar = (x1 < 2);
def isDownCloseBar = (x1 > 2);
def isMidCloseBar = (x1 < 2.2 && x1 > 1.8);
def isVeryHighCloseBar = (x1 < 1.35);
# C_RP 20100809 added isVeryLowCloseBar
def isVeryLowCloseBar = (x1 >= 2.65);
# Trend Definitions
rec fiveDaysSma = compoundValue(5, Average(close, 5)[0], Double.NaN);
def LongTermTrendSlope = LinearRegressionSlope(price = fiveDaysSma, length = longTermLength)[0]; # 40
def MiddleTermTrendSlope = LinearRegressionSlope(price = fiveDaysSma, length = midTermLength)[0]; # 15
def ShortTermTrendSlope = LinearRegressionSlope(price = fiveDaysSma, length = shortTermLength)[0]; # 5
######################################################################
# VSA Definitions
# utbar
rec isUpThrustBar = isWideSpreadBar && isDownCloseBar && ShortTermTrendSlope > 0 && MiddleTermTrendSlope > 0; #C_RP added positive middleTermTrendSlope requirement to filter out upThrusts in trends that are only short term. Consider adding longTermTrendSlope requirement as well.
# utcond1
def upThrustConditionOne = (isUpThrustBar[1] && isDownBar);
# utcond2
def upThrustConditionTwo = (isUpThrustBar[1] && isDownBar[0] && volume > volume[1]);
# utcond3
def upThrustConditionThree = (isUpThrustBar[0] && volume > 2 * sAvgVolume[0]);
# scond1
rec isConfirmedUpThrustBar = (upThrustConditionOne or upThrustConditionTwo or upThrustConditionThree);
# scond
rec isNewConfirmedUpThrustBar = (isConfirmedUpThrustBar[0] && !isConfirmedUpThrustBar[1]);
# Two Period UpThrust Bar
rec isTwoPerUpT = isUpBar[1] && isWideSpreadBar[1] && isDownBar[0] && isDownCloseBar[0] && !isUpThrustBar[0] && (AbsValue(open[1] - close[0]) < (GdojiFactor * spread[1])) ;
# Three Period UpThrust Bar
rec isThreePerUpT = isUpBar[2] && isWideSpreadBar[2] && isDownBar[0] && isDownCloseBar[0] && !isUpThrustBar[0] && (AbsValue(open[2] - close[0]) < (GdojiFactor * spread[2])) ;
# C_RP 20100816
# rec isGraveDojiBar = (spread > avgSpread) && (open == low) && (close == low); totally strict Gravestone Doji. Revised version below identifies a candle with above average spread, a real body smaller than 20% of the spread, and a lower wick less than 10% of the spread as a Gravestone Doji pictured as a white triangle above the candle.
rec isGraveDojiBar = (spread > avgSpread) && (AbsValue(open - close) < (GdojiFactor * spread)) && ((AbsValue(close - low) < (WickFactor * spread)) or (AbsValue(open - low) < (WickFactor * spread))); # less strict Gravestone Doji
rec isHammerBar = (spread > avgSpread) && (AbsValue(open - close) < (GdojiFactor * spread)) && ((AbsValue(close - high) < (WickFactor * spread)) or (AbsValue(open - high) < (WickFactor * spread))); # opposite of a less strict Gravestone Doji
# trbar
def reversalLikelyBar = (volume[1] > sAvgVolume[0] && isUpBar[1] && isWideSpreadBar[1] && isDownBar[0] && isDownCloseBar && isWideSpreadBar[0] && LongTermTrendSlope > 0 && high == Highest(high, 10)[0]);
# hutbar
rec isPseudoUpThrustBar = (isUpBar[1] && (volume[1] > aboveAvgVolfactor * sAvgVolume[0]) && isDownBar[0] && isDownCloseBar && !isWideSpreadBar[0] && !isUpThrustBar[0]);
# hutcond
def pseudoUpThrustConfirmation = (isPseudoUpThrustBar[1] && isDownBar[0] && isDownCloseBar && !isUpThrustBar[0]);
# C_RP Failed UpThrustConfirmation or pseudoUpThrustConfirmation occurs when the close of bar following such confirmation is not lower than the close of the confirmation bar
rec isFailedUpThrustConfirmation = (isNewConfirmedUpThrustBar[1] or pseudoUpThrustConfirmation[1]) && close[0] >= close[1];
# tcbar
def weaknessBar = (isUpBar[1] && high[0] == Highest(high, 5)[0] && isDownBar[0] && (isDownCloseBar or isMidCloseBar) && volume[0] > sAvgVolume[0] && !isWideSpreadBar[0] && !isPseudoUpThrustBar[0]);
# stdn, stdn0, stdn1, stdn2
def strengthInDownTrend = (volume[0] > volume[1] && isDownBar[1] && isUpBar[0] && (isUpCloseBar or isMidCloseBar) && ShortTermTrendSlope < 0 && MiddleTermTrendSlope < 0);
def strengthInDownTrend0 = (volume[0] > volume[1] && isDownBar[1] && isUpBar[0] && (isUpCloseBar or isMidCloseBar) && ShortTermTrendSlope < 0 && MiddleTermTrendSlope < 0 && LongTermTrendSlope < 0);
def strengthInDownTrend1 = (volume[0] > (sAvgVolume[0] * aboveAvgVolfactor) && isDownBar[1] && isUpBar[0] && (isUpCloseBar or isMidCloseBar) && ShortTermTrendSlope < 0 && MiddleTermTrendSlope < 0 && LongTermTrendSlope < 0);
def strengthInDownTrend2 = (volume[1] < sAvgVolume[0] && isUpBar[0] && isVeryHighCloseBar && volume[0] > sAvgVolume[0] && ShortTermTrendSlope < 0);
rec bycond1 = (strengthInDownTrend or strengthInDownTrend1);
# bycond
def isStrengthConfirmationBar = (isUpBar[0] && bycond1[1]);
# bycond2 C_RP UpClose on higher volume with all slopes down adds extra strength
def isStrengthConfirmationBar2 = (isUpBar[0] && isUpCloseBar[0] && volume[0] > volume[1] && LongTermTrendSlope < 0 && bycond1[1]);
# Failed strength in downtrend signal force a follow-up bar that closes below mid-point of confirmaton bar C_RP
def isFailedStrengthSignal = (isStrengthConfirmationBar[1] or isStrengthConfirmationBar2[1] or strengthInDownTrend2[1]) && close[0] <= (close[1] - (spread[1] / 2));
# stvol
def stopVolBar = low[0] == Lowest(low, 5)[0] && (isUpCloseBar or isMidCloseBar) && volume[0] > aboveAvgVolfactor * sAvgVolume[0] && LongTermTrendSlope < 0;
# C_RP stvol at highs - the opposite of stvol
def stopVolBarHighs = high[0] == Highest(high, 5)[0] && (isDownCloseBar or isMidCloseBar) && volume[0] > aboveAvgVolfactor * sAvgVolume[0] && LongTermTrendSlope > 0;
# ndbar, nsbar
def noDemandBar = (isUpBar[0] && isNarrowSpreadBar[0] && isTwoDaysLowVol && isDownCloseBar);
# C_RP 20100809
# def noSupplyBar = (isDownBar[0] && isNarrowSpreadBar[0] && isTwoDaysLowVol && isDownCloseBar);
def noSupplyBar = (isDownBar[0] && isNarrowSpreadBar[0] && isTwoDaysLowVol && isUpCloseBar);
# lvtbar, lvtbar1, lvtbar2
rec supplyTestBar = (isTwoDaysLowVol && low[0] < low[1] && isUpCloseBar);
def supplyTestInUpTrendBar = (volume[0] < sAvgVolume[0] && low[0] < low[1] && isUpCloseBar && LongTermTrendSlope > 0 && MiddleTermTrendSlope > 0 && isWideSpreadBar[0]);
def successfulSupplyTestBar = (supplyTestBar[1] && isUpBar[0] && isUpCloseBar);
def successfulSupplyTestBar2 = (successfulSupplyTestBar[1] && isUpBar[0] && x1 <= 2 && volume[0] > volume[1]); # C_RP x1 finds Mid and UpCloseBars
# dbar
def distributionBar = (volume[0] > ultraHighVolfactor * sAvgVolume[0] && isDownCloseBar && isUpBar[0] && ShortTermTrendSlope > 0 && MiddleTermTrendSlope > 0 && !isConfirmedUpThrustBar[0] && !isUpThrustBar[0]);
# eftup, eftupfl, eftdn
def effortToMoveUpBar = (high[0] > high[1] && low[0] > low[1] && close[0] > close[1] && close[0] >= ((high[0] - low[0]) * highCloseFactor + low[0]) && spread[0] > avgSpread && volume[0] > volume[1]);
def failedEffortUpMove = (effortToMoveUpBar[1] && (isUpThrustBar[0] or upThrustConditionOne or upThrustConditionTwo or upThrustConditionThree));
def effortToMoveDownBar = ( ((high[0] < high[1]) or (isWideSpreadBar && volume[0] > 1.5 * sAvgVolume[0])) && low[0] < low[1] && close[0] < close[1] && close[0] <= ((high[0] - low[0]) * lowCloseFactor + low[0]) && spread[0] > avgSpread && volume[0] > volume[1]);
#C_RP old code - def effortToMoveDownBar = (high[0] < high[1] && low[0] < low[1] && close[0] < close[1] && Close[0] <= ((high[0] - low[0]) * lowCloseFactor + low[0]) && spread[0] > avgSpread && volume[0] > volume[1]);
def hwbReaction = (hwb != 0.0) ; #C_RP
######################################################################
# set the shapes on the graph
# hwbReaction - cyan arrow on bottom for longs. If input hwb = 0 then hwbReactionis false and plot does not draw.
plot hwbReactionPlot = if hwbReaction then (low - 7 * TickSize()) else Double.NaN;
hwbReactionPlot.SetPaintingStrategy(PaintingStrategy.ARROW_UP);
hwbReactionPlot.SetDefaultColor(Color.CYAN);
hwbReactionPlot.HideBubble();
hwbReactionPlot.HideTitle();
# upthurst and NOT confirmed - red square on top
plot upThrustBarPlot = if isUpThrustBar[0] and !isNewConfirmedUpThrustBar[0] then (high + 2 * TickSize()) else Double.NaN;
upThrustBarPlot.SetPaintingStrategy(PaintingStrategy.LINE_VS_SQUARES);
upThrustBarPlot.SetStyle(Curve.POINTS);
upThrustBarPlot.SetDefaultColor(Color.RED);
upThrustBarPlot.HideBubble();
upThrustBarPlot.HideTitle();
# C_RP 20100816
# any instance of a Gravestone Doji - white triangle on top
plot GraveDojiBarPlot = if isGraveDojiBar[0] then (high + 4 * TickSize()) else Double.NaN;
GraveDojiBarPlot.SetPaintingStrategy(PaintingStrategy.LINE_VS_TRIANGLES);
GraveDojiBarPlot.SetStyle(Curve.POINTS);
GraveDojiBarPlot.SetDefaultColor(CreateColor(255, 255, 255));
GraveDojiBarPlot.HideBubble();
GraveDojiBarPlot.HideTitle();
# C_RP 20100816
# any instance of a Gravestone Doji - white triangle on top
plot HammerBarPlot = if isHammerBar[0] then (low - 4 * TickSize()) else Double.NaN;
HammerBarPlot.SetPaintingStrategy(PaintingStrategy.LINE_VS_TRIANGLES);
HammerBarPlot.SetStyle(Curve.POINTS);
HammerBarPlot.SetDefaultColor(CreateColor(255, 255, 255));
HammerBarPlot.HideBubble();
HammerBarPlot.HideTitle();
# C_RP
# Two Period UpThrust Plot - magenta triangle high on top
plot TwoPerUpTPlot = if isTwoPerUpT[0] then (high + 4 * TickSize()) else Double.NaN;
TwoPerUpTPlot.SetPaintingStrategy(PaintingStrategy.LINE_VS_TRIANGLES);
TwoPerUpTPlot.SetStyle(Curve.POINTS);
TwoPerUpTPlot.SetDefaultColor(Color.MAGENTA);
TwoPerUpTPlot.HideBubble();
TwoPerUpTPlot.HideTitle();
# C_RP
# Three Period UpThrust Plot - magenta triangle high on top
plot ThreePerUpTPlot = if isThreePerUpT[0] then (high + 4 * TickSize()) else Double.NaN;
ThreePerUpTPlot.SetPaintingStrategy(PaintingStrategy.LINE_VS_TRIANGLES);
ThreePerUpTPlot.SetStyle(Curve.POINTS);
ThreePerUpTPlot.SetDefaultColor(Color.MAGENTA);
ThreePerUpTPlot.HideBubble();
ThreePerUpTPlot.HideTitle();
# reversal likely - blue diamond on top C_RP red 6 * ticksize
plot reversalLikelyBarPlot = if reversalLikelyBar then (high + 6 * TickSize()) else Double.NaN;
reversalLikelyBarPlot.SetPaintingStrategy(PaintingStrategy.POINTS);
reversalLikelyBarPlot.SetDefaultColor(Color.RED);
reversalLikelyBarPlot.HideBubble();
reversalLikelyBarPlot.HideTitle();
# new confirmed upthrust bar - red triangle (down) on top C_RP for upThrustConditionOne only
plot isNewConfirmedUpThrustBarPlot = if isNewConfirmedUpThrustBar && upThrustConditionOne then (high + 2 * TickSize()) else Double.NaN;
isNewConfirmedUpThrustBarPlot.SetPaintingStrategy(PaintingStrategy.LINE_VS_TRIANGLES);
isNewConfirmedUpThrustBarPlot.SetDefaultColor(Color.RED);
isNewConfirmedUpThrustBarPlot.HideBubble();
isNewConfirmedUpThrustBarPlot.HideTitle();
# new confirmed upthrust bar - red triangle (down) on top C_RP red arrow down at 4 * tickSize for conditions 2 and 3
plot isNewConfirmedUpThrustBarPlot23 = if isNewConfirmedUpThrustBar && (upThrustConditionTwo or upThrustConditionThree) then (high + 4 * TickSize()) else Double.NaN;
isNewConfirmedUpThrustBarPlot23.SetPaintingStrategy(PaintingStrategy.ARROW_DOWN);
isNewConfirmedUpThrustBarPlot23.SetDefaultColor(Color.RED);
isNewConfirmedUpThrustBarPlot23.HideBubble();
isNewConfirmedUpThrustBarPlot23.HideTitle();
# strength in down trend - lime square on bottom C_RP cyan for weakest strengthInDownTrend
plot strengthInDownTrendPlot = if strengthInDownTrend then (low - 4 * TickSize()) else Double.NaN;
strengthInDownTrendPlot.SetPaintingStrategy(PaintingStrategy.LINE_VS_SQUARES);
strengthInDownTrendPlot.SetDefaultColor(Color.CYAN);
strengthInDownTrendPlot.HideBubble();
strengthInDownTrendPlot.HideTitle();
# strength in down trend - lime square on bottom C_RP for next-to-weakest strengthInDownTrend
plot strengthInDownTrend1Plot = if strengthInDownTrend1 then (low - 4 * TickSize()) else Double.NaN;
strengthInDownTrend1Plot.SetPaintingStrategy(PaintingStrategy.LINE_VS_SQUARES);
strengthInDownTrend1Plot.SetDefaultColor(Color.GREEN);
strengthInDownTrend1Plot.HideBubble();
strengthInDownTrend1Plot.HideTitle();
# supply test in up trend - lime square on bottom of the bar C_RP grey
plot supplyTestInUpTrendBarPlot = if supplyTestInUpTrendBar then (low - 4 * TickSize()) else Double.NaN;
supplyTestInUpTrendBarPlot.SetPaintingStrategy(PaintingStrategy.LINE_VS_SQUARES);
supplyTestInUpTrendBarPlot.SetDefaultColor(CreateColor(153, 153, 153));
supplyTestInUpTrendBarPlot.HideBubble();
supplyTestInUpTrendBarPlot.HideTitle();
# successful test for supply - yellow triangle up on bottom of the bar C_RP cyan
plot successfulSupplyTestBarPlot = if successfulSupplyTestBar or successfulSupplyTestBar2 then (low - 2 * TickSize()) else Double.NaN;
successfulSupplyTestBarPlot.SetPaintingStrategy(PaintingStrategy.LINE_VS_TRIANGLES);
successfulSupplyTestBarPlot.SetDefaultColor(Color.CYAN);
successfulSupplyTestBarPlot.HideBubble();
successfulSupplyTestBarPlot.HideTitle();
# successful test for supply - yellow triangle up on bottom of the bar C_RP cyan double triangle for strong follow-up bar
plot successfulSupplyTestBarPlot2 = if successfulSupplyTestBar2 then (low - 4 * TickSize()) else Double.NaN;
successfulSupplyTestBarPlot2.SetPaintingStrategy(PaintingStrategy.LINE_VS_TRIANGLES);
successfulSupplyTestBarPlot2.SetDefaultColor(Color.CYAN);
successfulSupplyTestBarPlot2.HideBubble();
successfulSupplyTestBarPlot2.HideTitle();
# stopping volume green (diamond) circle at bottom of bar
plot stopVolBarPlot = if stopVolBar then (low - 2 * TickSize()) else Double.NaN;
stopVolBarPlot.SetPaintingStrategy(PaintingStrategy.LINE_VS_POINTS);
stopVolBarPlot.SetDefaultColor(Color.GREEN);
stopVolBarPlot.HideBubble();
stopVolBarPlot.HideTitle();
# stopping volume yellow (diamond) circle at top of bar
plot stopVolBarHighsPlot = if stopVolBarHighs then (high + 7 * TickSize()) else Double.NaN;
stopVolBarHighsPlot.SetPaintingStrategy(PaintingStrategy.LINE_VS_POINTS);
stopVolBarHighsPlot.SetDefaultColor(Color.YELLOW);
stopVolBarHighsPlot.HideBubble();
stopVolBarHighsPlot.HideTitle();
# green triangle up at bottom of the bar C_RP Green arrow up 4 * tickSize for strong strength_In_DownTrend
plot isStrengthConfirmationBarPlot = if isStrengthConfirmationBar then (low - 4 * TickSize()) else Double.NaN;
isStrengthConfirmationBarPlot.SetPaintingStrategy(PaintingStrategy.ARROW_UP);
isStrengthConfirmationBarPlot.SetDefaultColor(Color.GREEN);
isStrengthConfirmationBarPlot.HideBubble();
isStrengthConfirmationBarPlot.HideTitle();
# green triangle up at bottom of the bar C_RP Green arrow up 7 * tickSize for strongest strength_In_DownTrend with isUpCloseBar
plot isStrengthConfirmationBarPlot2 = if isStrengthConfirmationBar2 then (low - 7 * TickSize()) else Double.NaN;
isStrengthConfirmationBarPlot2.SetPaintingStrategy(PaintingStrategy.ARROW_UP);
isStrengthConfirmationBarPlot2.SetDefaultColor(Color.GREEN);
isStrengthConfirmationBarPlot2.HideBubble();
isStrengthConfirmationBarPlot2.HideTitle();
# blue square at top of bar C_RP orange
plot isPseudoUpThrustBarPlot = if isPseudoUpThrustBar then (high + 2 * TickSize()) else Double.NaN;
isPseudoUpThrustBarPlot.SetPaintingStrategy(PaintingStrategy.LINE_VS_SQUARES);
isPseudoUpThrustBarPlot.SetDefaultColor(CreateColor(255, 102, 102));
isPseudoUpThrustBarPlot.HideBubble();
isPseudoUpThrustBarPlot.HideTitle();
# blue triangle (down) at top of bar C_RP orange
plot pseudoUpThrustConfirmationPlot = if pseudoUpThrustConfirmation then (high + 2 * TickSize()) else Double.NaN;
pseudoUpThrustConfirmationPlot.SetPaintingStrategy(PaintingStrategy.LINE_VS_TRIANGLES);
pseudoUpThrustConfirmationPlot.SetDefaultColor(CreateColor(255, 102, 102));
pseudoUpThrustConfirmationPlot.HideBubble();
pseudoUpThrustConfirmationPlot.HideTitle();
# Failed UpthrustBarPlot Confirmation plots a green square 2 * tickSize above the failed bar C_RP
plot FailedUpThrustConfirmationPlot = if isFailedUpThrustConfirmation then (high + 2 * TickSize()) else Double.NaN;
FailedUpThrustConfirmationPlot.SetPaintingStrategy(PaintingStrategy.LINE_VS_SQUARES);
FailedUpThrustConfirmationPlot.SetDefaultColor(Color.GREEN);
FailedUpThrustConfirmationPlot.HideBubble();
FailedUpThrustConfirmationPlot.HideTitle();
# yellow triangle (down) at top of bar
plot weaknessBarPlot = if weaknessBar then (high + 2 * TickSize()) else Double.NaN;
weaknessBarPlot.SetPaintingStrategy(PaintingStrategy.LINE_VS_TRIANGLES);
weaknessBarPlot.SetDefaultColor(Color.YELLOW);
weaknessBarPlot.HideBubble();
weaknessBarPlot.HideTitle();
# aqua triangle up at bottom of bar C_RP green triangle for next-to-strongest strengthInDownTrend
plot strengthInDownTrend2Plot = if strengthInDownTrend2 then (low - 2 * TickSize()) else Double.NaN;
strengthInDownTrend2Plot.SetPaintingStrategy(PaintingStrategy.LINE_VS_TRIANGLES);
strengthInDownTrend2Plot.SetDefaultColor(Color.GREEN); # ????
strengthInDownTrend2Plot.HideBubble();
strengthInDownTrend2Plot.HideTitle();
# Failed strength in downtrend signal plots red square at candle's bottom. Under rare conditions a strengthinDownTrend2 green triangle can be overwritten by a successfulsupplyTest cyan triangle below the previous bar. If the bar following the cyan triangle is a FailedStrengthSignal a red square will be plotted on the following bar which is a desirable artifact of this coincidence.
plot failedstrengthsignalPlot = if isFailedStrengthSignal then (low - 2 * TickSize()) else Double.NaN;
failedstrengthsignalPlot.SetPaintingStrategy(PaintingStrategy.LINE_VS_SQUARES);
failedstrengthsignalPlot.SetDefaultColor(Color.RED);
failedstrengthsignalPlot.HideBubble();
failedstrengthsignalPlot.HideTitle();
# distribution at end of uptrend - blue square on top C_RP magenta
plot distributionBarPlot = if distributionBar then (high + 2 * TickSize()) else Double.NaN;
distributionBarPlot.SetPaintingStrategy(PaintingStrategy.LINE_VS_SQUARES);
distributionBarPlot.SetDefaultColor (Color.MAGENTA);
distributionBarPlot.HideBubble();
distributionBarPlot.HideTitle();
# supply test bar - pink square on bottom C_RP white
plot supplyTestBarPlot = if supplyTestBar then (low - 2 * TickSize()) else Double.NaN;
supplyTestBarPlot.SetPaintingStrategy(PaintingStrategy.LINE_VS_SQUARES);
supplyTestBarPlot.SetDefaultColor(GlobalColor("symbolWhite"
);
supplyTestBarPlot.HideBubble();
supplyTestBarPlot.HideTitle();
# no demand bar - blue squre on top C_RP orange circle
plot noDemandBarPlot = if noDemandBar then (high + 2 * TickSize()) else Double.NaN;
noDemandBarPlot.SetPaintingStrategy(PaintingStrategy.LINE_VS_POINTS);
noDemandBarPlot.SetDefaultColor(CreateColor(255, 102, 102));
noDemandBarPlot.HideBubble();
noDemandBarPlot.HideTitle();
# no supply bar - lime diamond on bottom C_RP turquoise
plot noSupplyBarPlot = if noSupplyBar then (low - 2 * TickSize()) else Double.NaN;
noSupplyBarPlot.SetPaintingStrategy(PaintingStrategy.LINE_VS_POINTS);
noSupplyBarPlot.SetDefaultColor (Color.CYAN);
noSupplyBarPlot.HideBubble();
noSupplyBarPlot.HideTitle();
# effort to move up - turquoise diamond in the median of the bar C_RP green
plot effortToMoveUpBarPlot = if effortToMoveUpBar then (median) else Double.NaN;
effortToMoveUpBarPlot.SetPaintingStrategy(PaintingStrategy.LINE_VS_POINTS);
effortToMoveUpBarPlot.SetDefaultColor(CreateColor(0, 255, 0));
effortToMoveUpBarPlot.HideBubble();
effortToMoveUpBarPlot.HideTitle();
# effort to move down - yellow diamond in the median of the bar C_RP for all except red bars the circle's color is magenta
plot effortToMoveDownBarPlot = if effortToMoveDownBar && !(ShortTermTrendSlope < 0 && MiddleTermTrendSlope < 0 && LongTermTrendSlope < 0) then (median) else Double.NaN;
effortToMoveDownBarPlot.SetPaintingStrategy(PaintingStrategy.LINE_VS_POINTS);
effortToMoveDownBarPlot.SetDefaultColor(Color.MAGENTA);
effortToMoveDownBarPlot.HideBubble();
effortToMoveDownBarPlot.HideTitle();
# effort to move down - yellow diamond in the median of the bar C_RP yellow circle for Red bars
plot effortToMoveDownBarPlotYel = if effortToMoveDownBar && ShortTermTrendSlope < 0 && MiddleTermTrendSlope < 0 && LongTermTrendSlope < 0 then (median) else Double.NaN;
effortToMoveDownBarPlotYel.SetPaintingStrategy(PaintingStrategy.LINE_VS_POINTS);
effortToMoveDownBarPlotYel.SetDefaultColor(Color.YELLOW);
effortToMoveDownBarPlotYel.HideBubble();
effortToMoveDownBarPlotYel.HideTitle();
######
# Candle definitions
AssignPriceColor( if colorBars and ShortTermTrendSlope > 0 and MiddleTermTrendSlope > 0 and LongTermTrendSlope > 0 then CreateColor(0, 255, 0) # UUU Green
else if colorBars and ShortTermTrendSlope > 0 and MiddleTermTrendSlope > 0 and LongTermTrendSlope < 0 then CreateColor(153, 255, 102) # UUD Lime Green
else if colorBars and ShortTermTrendSlope > 0 and MiddleTermTrendSlope < 0 and LongTermTrendSlope < 0 then CreateColor(153, 255, 255) # UDD Light Cyan
else if colorBars and ShortTermTrendSlope < 0 and MiddleTermTrendSlope < 0 and LongTermTrendSlope < 0 then Color.RED # DDD Red
else if colorBars and ShortTermTrendSlope < 0 and MiddleTermTrendSlope > 0 and LongTermTrendSlope > 0 then Color.ORANGE # DUU Orange
else if colorBars and ShortTermTrendSlope < 0 and MiddleTermTrendSlope < 0 and LongTermTrendSlope > 0 then Color.ORANGE # DDU Orange
else if colorBars then CreateColor(153, 153, 153) else Color.CURRENT); # all other combinations are Light Gray
#######
# Trend Text Definitions
# some colors changed to match symbols with text backgrounds
AddLabel(trendText, Concat("Vol: ", if volume > sAvgVolume[0] + 2.0 * sAvgVolumeSTD then "VH"
else if volume[0] > (sAvgVolume[0] + 1.0 * sAvgVolumeSTD) then "H"
else if (volume[0] > sAvgVolume[0]) then ">Avg"
else if (volume[0] < sAvgVolume[0] && volume[0] > (sAvgVolume[0] - 1.0 * sAvgVolumeSTD)) then "<Avg"
else if (volume[0] < (sAvgVolume[0] - 1.0 * sAvgVolumeSTD)) then "L"
else ""
, Color.WHITE);
AddLabel(trendText, Concat("Spr: ", if (spread > (avgSpread * 2.0)) then "W"
else if (spread > avgSpread) then ">Avg"
else "N"
, Color.WHITE);
# C_RP 20100809 added isVeryLowCloseBar and changed execution order so that both Verys and Mid execute first
AddLabel(trendText, Concat("Cls: ", if (isVeryHighCloseBar) then "VH"
else if (isVeryLowCloseBar) then "VL"
else if (isMidCloseBar) then "M"
else if (isUpCloseBar) then "H"
else if (isDownCloseBar) then "D"
else "NC"
, Color.WHITE);
AddLabel(trendText, Concat("Trd: ", Concat("St-", if (ShortTermTrendSlope > 0) then "U"
else "D"
), Color.WHITE);
AddLabel(trendText, Concat("Mt-", if (MiddleTermTrendSlope > 0) then "U" else "D"
, Color.WHITE);
AddLabel(trendText, Concat("Lt-", if (LongTermTrendSlope > 0) then "U" else "D"
, Color.WHITE);
######
# Volume Bar Definitions
AddLabel(volumeDefinitions, if isUpThrustBar[0] then "Weakness on UpThrust" #C_RP Red Square
else if upThrustConditionOne then "Weakness confirmed on Downbar after UpThrust" #C_RP Red Triangle
else if upThrustConditionTwo && !upThrustConditionOne then "Weakness confirmed on High-volume Downbar after UpThrust" #C_RP Red DownArrow
else if upThrustConditionThree then "Weakness confirmed on High-volume UpThrust" #C_RP Red DownArrow
else if isTwoPerUpT then "Weakness on 2-period UpThrust" #C_RP Magenta Triangle
else if isThreePerUpT then "Weakness on 3-period UpThrust" #C_RP Magenta Triangle
else if isGraveDojiBar then "Reversal possible on Gravestone Doji" #C_RP White Triangle
else if isHammerBar then "Reversal possible on Hammer Doji" #C_RP White Triangle
else if strengthInDownTrend then "Strength returning in Downtrend" #C_RP Cyan Square
else if strengthInDownTrend0 then "Strength returning in long Downtrend" #C_RP Cyan Square
else if strengthInDownTrend1 then "Strength returning on High Volume in Downtrend" #C_RP Green Square
else if strengthInDownTrend2 then "Strength on High-volume UpBar closing on High" #C_RP Green Triangle
else if supplyTestBar[0] then "Test for Supply" #C_RP White Square
else if successfulSupplyTestBar[0] then "Strength confirmed on UpBar closing Near High after Test" #C_RP Cyan Triangle
else if isStrengthConfirmationBar then "Strength confirmed on UpBar" #C_RP Green UpArrow
else if isStrengthConfirmationBar2 then "Strength confirmed on UpBar closing Near High" #C_RP Two Green UpArrows
else if isFailedStrengthSignal then "Bearish on Failed Strength Confirmation in downtrend" #C_RP Red Square
else if distributionBar then "Distribution on High-volume UpBar closing Down in Uptrend" #C_RP Magenta Square
else if isPseudoUpThrustBar[0] then "Weakness on Pseudo-UpThrust." #C_RP Orange Square
else if pseudoUpThrustConfirmation then "Weakness confirmed on DownBar closing Down after PseudoUpThrust" #C_RP Orange Triangle
else if isFailedUpThrustConfirmation then "Less Bearish on Failed UpThrust Confirmation" #C_RP Green Square
else if supplyTestInUpTrendBar then "Test for Supply in Uptrend" #C_RP Gray Square
else if weaknessBar then "Weakness on High-volume DownBar after High-volume UpMove" #C_RP Yellow Triangle
else if noDemandBar then "Weakness on No Demand" #C_RP Orange Circle
else if noSupplyBar then "Strength on No Supply" #C_RP Cyan Circle
else if effortToMoveUpBar[0] then "Bullish on Effort-to-Rise" #C_RP Green Circle on middle of Bar
else if effortToMoveDownBar then "Bearish on Effort-to-Fall" #C_RP Magenta or Yellow Circle on middle of Bar
else if failedEffortUpMove then "Bearish on Failed Effort-to-Rise" #C_RP no symbol for this indication
else if stopVolBar then "Stopping Volume at Lows indicates Downtrend end likely" #C_RP Green Circle
else if stopVolBarHighs then "Stopping Volume at Highs indicates Uptrend end likely" #C_RP Yellow Circle
else "",
if isUpThrustBar[0] then Color.RED
else if upThrustConditionOne then Color.RED
else if upThrustConditionTwo && !upThrustConditionOne then Color.RED
else if upThrustConditionThree then Color.RED
else if isTwoPerUpT then Color.MAGENTA
else if isThreePerUpT then Color.MAGENTA
else if isGraveDojiBar or isHammerBar then CreateColor(255, 255, 255)
else if strengthInDownTrend1 then Color.GREEN
else if strengthInDownTrend0 && !strengthInDownTrend then Color.CYAN
else if strengthInDownTrend && !strengthInDownTrend1 then Color.CYAN
else if isFailedStrengthSignal then Color.RED
else if supplyTestBar[0] then GlobalColor("symbolWhite"
else if successfulSupplyTestBar[0] then CreateColor(102, 255, 0)
else if isStrengthConfirmationBar then Color.GREEN
else if distributionBar then Color.MAGENTA
else if isPseudoUpThrustBar[0] then (CreateColor(255, 102, 102))
else if pseudoUpThrustConfirmation then (CreateColor(255, 102, 102))
else if isFailedUpThrustConfirmation then (Color.GREEN)
else if supplyTestInUpTrendBar then CreateColor(153, 153, 153)
else if strengthInDownTrend2 then Color.GREEN
else if weaknessBar then Color.ORANGE
else if noDemandBar then CreateColor(255, 102, 102)
else if noSupplyBar then Color.CYAN
else if effortToMoveUpBar[0] then CreateColor(0, 255, 0)
else if effortToMoveDownBar then Color.MAGENTA
else if failedEffortUpMove then Color.BLUE
else if stopVolBar then Color.GREEN
else if stopVolBarHighs then Color.YELLOW
else Color.BLACK);
########
# Alerts
Alert(if alerts and (isUpThrustBar[0]
or upThrustConditionOne
or (upThrustConditionTwo && !upThrustConditionOne)
or upThrustConditionThree
or strengthInDownTrend1
or (strengthInDownTrend0 && !strengthInDownTrend)
or (strengthInDownTrend && !strengthInDownTrend1)
or supplyTestBar[0]
or successfulSupplyTestBar[0]
or isStrengthConfirmationBar
or distributionBar
or isPseudoUpThrustBar[0]
or pseudoUpThrustConfirmation
or supplyTestInUpTrendBar
or strengthInDownTrend2
or weaknessBar
or noDemandBar
or noSupplyBar
or effortToMoveUpBar[0]
or effortToMoveDownBar
or failedEffortUpMove
or stopVolBar) then 1 else 0, if isUpThrustBar[0] then "An Upthrust Bar. A sign of weakness."
else if upThrustConditionOne then "A downbar after an Upthrust. Confirm weakness."
else if upThrustConditionTwo && !upThrustConditionOne then "A High Volume downbar after an Upthrust. Confirm weakness."
else if upThrustConditionThree then "This upthrust at very High Volume, Confirms weakness."
else if strengthInDownTrend1 then "Strength seen returning after a down trend. High volume adds to strength. "
else if strengthInDownTrend0 && !strengthInDownTrend then "Strength seen returning after a down trend."
else if strengthInDownTrend && !strengthInDownTrend1 then "Strength seen returning after a long down trend."
else if supplyTestBar[0] then "Test for supply."
else if successfulSupplyTestBar[0] then "An Upbar closing near High after a Test confirms strength."
else if isStrengthConfirmationBar then "An Upbar closing near High. Confirms return of Strength."
else if distributionBar then "A High Volume Up Bar closing down in a uptrend shows Distribution."
else if isPseudoUpThrustBar[0] then "Psuedo UpThrust. A Sign of Weakness."
else if pseudoUpThrustConfirmation then "A Down Bar closing down after a Pseudo Upthrust confirms weakness."
else if supplyTestInUpTrendBar then "Test for supply in a uptrend. Sign of Strength."
else if strengthInDownTrend2 then "High volume upbar closing on the high indicates strength."
else if weaknessBar then "High volume Downbar after an upmove on high volume indicates weakness."
else if noDemandBar then "No Demand. A sign of Weakness."
else if noSupplyBar then "No Supply. A sign of Strength."
else if effortToMoveUpBar[0] then "Effort to Rise. Bullish sign."
else if effortToMoveDownBar then "Effort to Fall. Bearish sign."
else if failedEffortUpMove then "Effort to Move up has failed. Bearish sign."
else if stopVolBar then "Stopping volume. Normally indicates end of bearishness is nearing."
else "", Alert.BAR, Sound.Ding);
# Red Square - UpThrust bar.
# Blue Diamond - Reversal possible, yesterday was high volume wide spread up bar, but
# today we reached 10 days high with low close wide spread down bar.
# Red Triangle Down - UpThrust confirmation.
# Lime Square - Strength bar (either strength is showing in down trend or a supply
# test in up trend).
# Yellow Triangle Up - An Upbar closing near High after a Test confirms strength.
# Lime Diamond - Stopping volume. Normally indicates end of bearishness is nearing
# /OR/ No supply.
# Lime Triangle Up - The previous bar saw strength coming back, This upbar confirms strength.
# Blue Square - Psuedo UpThrust, A Sign of Weakness /OR/ A High Volume Up Bar closing
# down in a uptrend shows Distribution /OR/ No Demand.
# Blue Triangle Down - A Down Bar closing down after a Pseudo Upthrust confirms weakness.
# Yellow Triangle Down - High volume Downbar after an upmove on high volume indicates weakness.
# Aqua Triangle Up - High volume upbar closing on the high indicates strength (in short
# term down trend).
# Deep Pink Square - Test for supply.
# Turquoise Diamond - Effort to Rise. Bullish sign.
# Yellow Diamond - Effort to Fall. Bearish sign.
I don't want to do away with any of the study, just move it to a subgraph below. I'm trying to figure out how to buy you that cup of coffee as I read somewhere else on this site. I take it that's done through paypal?
Any help is appreciated sir.
Dan
|
Re: Touchup to VSA Script August 12, 2015 02:18AM |
Registered: 10 years ago Posts: 615 |
My wife and I recently moved to a new house and have been trying to get the old one prepped and listed with a real estate agent so I haven't had much time for scripting of late.
I appreciate the feedback and the kind words. Glad to hear that the code is working well for you.
This should plot every signal arrow and not just the first one.
change from
to
If you are happy with the candle colors but are only concerned that you can't tell the difference between an up and a down candle, then a change in the chart settings can remedy that.
In the below screenshot, up and down candles look the same because both candle bodies are filled with color.

Change this by right-clicking on the chart then opening the style settings panel.

From the appearance tab uncheck "fill up".

Now up and down candles are distinguishable—up candles are outlines while down candles are solid.

Yes, it's done through paypal. Just follow the link in my signature below.
- robert
Professional ThinkorSwim indicators for the average Joe
Edited 1 time(s). Last edit at 08/12/2015 02:50AM by robert.
Quote
baffled1
Robert, I have to thank you again for the Robert's Averaging algo. It is serving me well. I can trade it standalone with my TriplePoint algo (the one you helped me with), and I also use it to help guide me when using the Evil Algo hot smiley . And maybe even more importantly, it gives me a template for other Averaging operations. You da man!!
I appreciate the feedback and the kind words. Glad to hear that the code is working well for you.
Quote
Palmer
Robert: I tried to change this aspect of the code where EVERY cross was counted but didn't have too much luck. Can you tweak that one line so EVERY cross is counted? If the labels overlap I should be able to visually figure it out.
This should plot every signal arrow and not just the first one.
change from
plot SignalUP = Xup and Sum(Xup[1], DaysAfterCross) == 0;
to
plot SignalUP = Xup;
Quote
danyzuko
I love the following script which is called volume spread analysis. It gives cues to strength and weakness with dots and what not.
It also colors the price bars red when price is nearing a turn around at the lows and Green when it reaches the High. However, those colors override the red and green of the regular chart showing when price moved up or down for that bar. Do you think you could strip out the color coding of the price bars and provide me with the ability to represent it as a volume sub graph with the volume bars colored in the same fashion?
If you are happy with the candle colors but are only concerned that you can't tell the difference between an up and a down candle, then a change in the chart settings can remedy that.
In the below screenshot, up and down candles look the same because both candle bodies are filled with color.
Change this by right-clicking on the chart then opening the style settings panel.
From the appearance tab uncheck "fill up".
Now up and down candles are distinguishable—up candles are outlines while down candles are solid.
Quote
danyzuko
I'm trying to figure out how to buy you that cup of coffee as I read somewhere else on this site. I take it that's done through paypal?
Yes, it's done through paypal. Just follow the link in my signature below.
- robert
Professional ThinkorSwim indicators for the average Joe
Edited 1 time(s). Last edit at 08/12/2015 02:50AM by robert.
|
Re: Touchup to VSA Script August 12, 2015 07:18AM |
Registered: 9 years ago Posts: 7 |
|
Thinkscript Fixed stop Loss problem August 13, 2015 03:02PM |
Registered: 8 years ago Posts: 6 |
Hi,
I am developing a Thinkscript EXIT LONG script that will set the STOP LOSS value to be the lowest of the 5 bars prior to entering the trade..
It seems like the script always uses the lowest of the most recent 5 bars and not the 5 bars just prior to entering long.
My incorrect script so far is:
#
# JustSellStrategyFixedStopLoss
#
def sell = if close < open and close[1] < open[1] then 1 else 0; # if true, long trade is active
rec FixedStopLoss = if !sell then lowest(low[1],5) else double.nan ;
AddOrder(OrderType.SELL_TO_CLOSE, sell, FixedStopLoss, tickColor = Color.RED, arrowColor = Color.RED);
Any help MUCH appreciated.
Thanks,
Gary
|
Re: Thinkscript Fixed stop Loss problem August 13, 2015 04:04PM |
Registered: 10 years ago Posts: 615 |
TraderBuddy,
Try changing this line:
to this instead:
- robert
Professional ThinkorSwim indicators for the average Joe
Try changing this line:
rec FixedStopLoss = if !sell then lowest(low[1],5) else double.nan ;
to this instead:
rec FixedStopLoss = if sell then lowest(low[1],5) else FixedStopLoss[1];
- robert
Professional ThinkorSwim indicators for the average Joe
|
Re: Thinkscript Fixed stop Loss problem August 13, 2015 05:42PM |
Registered: 8 years ago Posts: 6 |
Hi Robert.
It's getting closer, but does not appear to be looking 5 bars before trade was entered as you can see in screenshot below.
The gray font is for entry but the stop loss occurred too soon.
here is code for stop loss:
#
# JustSellStrategyFixedStopLoss
#
def sell = if close < open and close[1] < open[1] then 1 else 0; # if true, long trade is active
rec FixedStopLoss = if sell then lowest(low[1],5) else FixedStopLoss[1];
AddOrder(OrderType.SELL_TO_CLOSE, low <= FixedStopLoss, FixedStopLoss, tickColor = Color.RED, arrowColor = Color.RED);
Sorry, I was unable to include screenshot. Chat wants a URL and I have screenshot on my hard drive..
Not sure how to send it. I can send email if that works.
Thanks,
Gary
|
Re: Thinkscript Fixed stop Loss problem August 14, 2015 09:53AM |
Registered: 8 years ago Posts: 6 |

|
Re: Thinkscript Fixed stop Loss problem August 15, 2015 03:31AM |
Registered: 10 years ago Posts: 615 |
Quote
TraderBuddy
Sorry, I was unable to include screenshot. Chat wants a URL and I have screenshot on my hard drive..
Not sure how to send it.
You'll need to upload your screenshot to an image hosting site such as [imgur.com] first then copy and paste the BBcode into your message here. Watch this short video for a demonstration.

Quote
TraderBuddy
I will be happy to add to your tip jar if you can help me solve this.
The bit of code you posted above is only a portion of the larger script. If you'll post the entire script and give a short description of what you are trying to accomplish, I'll figure things out. If you don't want to post your script to the open forum, then you can send it to me in a private message.
- robert
Professional ThinkorSwim indicators for the average Joe
|
Re: Thinkscript Fixed stop Loss problem August 15, 2015 09:17AM |
Registered: 8 years ago Posts: 6 |
The LONG entry and exit of the ThreeOutOneInStrategy works as follows:
From Keltner Channels set as ( ), the SETUP is three adjacent candles that close outside the Lower Keltner band followed by the TRIGGER candle which is the very next candle that closes inside the Keltner band. Enter long at this point. The LONG EXIT will be when the high of one of the following candles touches two tics below the current upper Keltner band. The stop loss will be the lowest low of the Five (5) candles prior to the trigger candle. The stop loss will not change while the trade is active.
I would like the strategy (and corresponding study displaying Keltner bands, stop loss, and target) to perform as described above with red dots showing the stop loss below each candle from the trigger forward until it is hit or the profit target is reached (maybe green dots 2 Tics below upper Keltner band displayed only while trade is active).
So far I have the following Thinkscript code:
#
# MyKeltnerChannel
#
declare weak_volume_dependency;
input displace = 0;
input factor = 1.5;
input length = 20;
input price = close;
input averageType = AverageType.SIMPLE;
input trueRangeAverageType = AverageType.SIMPLE;
def shift = factor * MovingAverage(trueRangeAverageType, TrueRange(high, close, low), length);
def average = MovingAverage(averageType, price, length);
plot Avg = average[-displace];
Avg.SetDefaultColor(GetColor(1));
plot Upper_Band = average[-displace] + shift[-displace];
Upper_Band.SetDefaultColor(Color.Red);
plot Lower_Band = average[-displace] - shift[-displace];
Lower_Band.SetDefaultColor(Color.Green);
|
Re: Thinkscript Fixed stop Loss problem August 15, 2015 07:23PM |
Registered: 8 years ago Posts: 6 |
Hi Robert,
I am resending it looks like part of original got cut off.
The LONG entry and exit of the ThreeOutOneInStrategy works as follows:
SETUP includes the 8 EMA is between the Keltner bands at all times during setup and trigger. The SETUP is three adjacent candles that close outside the Lower Keltner band followed by the TRIGGER candle which is the very next candle that closes inside the Lower Keltner band. Enter long at this point. The LONG EXIT will be when the high of one of the following candles touches two tics below the current upper Keltner band. The stop loss will be the lowest low of the Five (5) candles prior to the trigger candle. The stop loss will not change while the trade is active.
I would like the strategy (and corresponding study displaying Keltner bands, stop loss, and target) to perform as described above with red dots showing the stop loss below each candle from the trigger forward until it is hit or when the profit target is reached (maybe green dots 2 Tics below upper Keltner band displayed only while trade is active).
So far I have the following Thinkscript code:
#
# MyKeltnerChannel
#
input price = close;
input EXPlength = 8;
input displace = 0;
plot AvgExp = ExpAverage(price[-displace], EXPlength);
AvgExp.SetDefaultColor(Color.BLACK);
AvgExp.SetLineWeight(3) ;
input factor = 1.5;
input length = 20;
input averageType = AverageType.SIMPLE;
input trueRangeAverageType = AverageType.SIMPLE;
def shift = factor * MovingAverage(trueRangeAverageType, TrueRange(high, close, low), length);
def average = MovingAverage(averageType, price, length);
plot Avg = average[-displace];
Avg.SetDefaultColor(GetColor(1));
plot Upper_Band = average[-displace] + shift[-displace];
Upper_Band.SetDefaultColor(Color.Red);
plot Lower_Band = average[-displace] - shift[-displace];
Lower_Band.SetDefaultColor(Color.Green);
#
# Three Out 1 In Long Entry Strategy
#
# Input Declarations:
#
input opentime = 0930;
input closetime = 1600;
input displace = 0;
input factor = 1.5;
input length = 20;
input price = close;
input averageType = AverageType.SIMPLE;
input trueRangeAverageType = AverageType.SIMPLE;
def shift = factor * MovingAverage(trueRangeAverageType, TrueRange(high, close, low), length);
def average = MovingAverage(averageType, price, length);
def EMA8 =ExpAverage (close, 8) ;
def Upper_Band = average[-displace] + shift[-displace];
def Lower_Band = average[-displace] - shift [-displace];
input BarsForSwing = 5;
input TicStopLoss = 2 ;
#
# Only enter during market hours:
#
def AP = GetAggregationPeriod();
def daily = if AP >= AggregationPeriod.DAY then 1 else 0;
#def isopen = if daily then 1 else if SecondsFromTime(opentime) >= 0 and SecondsTillTime(closetime) >= 0 then 1 else 0;
#
# Define the entry trigger:
#
def isopen = 1 ; # do any time
def EnterLong = if close[3] < lower_Band[3] and close[2] < lower_Band[2]and close[1] < lower_Band [1] and close > lower_band then 1 else 0 ;
#
# If market open and 3 Out and 1 in then enter on bar close:
#
def EMAsInside = if lower_Band[3] < EMA8[3] and lower_Band[2] < EMA8 [2]and lower_Band[1] < EMA8[1] then 1 else 0 ;
def trigger = if isopen and EMAsInside and EnterLong then 1 else 0;
def orderprice = close;
#
# This code triggers the strategy on the chart.
# Arg. 1 adds order if true, nothing if false
# Arg. 2 is the entry price
#
AddOrder(OrderType.BUY_TO_OPEN, trigger, orderprice, tickColor = Color.GRAY, arrowColor = Color.GRAY);
#
# Three Out 1 In Long Exit Strategy
#
# Input Declarations:
#
input opentime = 0930;
input closetime = 1600;
input displace = 0;
input factor = 1.5;
input length = 20;
input price = close;
input averageType = AverageType.SIMPLE;
input trueRangeAverageType = AverageType.SIMPLE;
def shift = factor * MovingAverage(trueRangeAverageType, TrueRange(high, close, low), length);
def average = MovingAverage(averageType, price, length);
def EMA8 =ExpAverage (close, 8) ;
def Upper_Band = average[-displace] + shift[-displace];
def Lower_Band = average[-displace] - shift [-displace];
input BarsForSwing = 5;
input TicStopLoss = 0.50; # 2 Tics for ES
#
# Only enter during market hours:
#
def AP = GetAggregationPeriod();
def daily = if AP >= AggregationPeriod.DAY then 1 else 0;
#def isopen = if daily then 1 else if SecondsFromTime(opentime) >= 0 and SecondsTillTime(closetime) >= 0 then 1 else 0;
#
# Define the entry trigger:
#
def isopen = 1 ; # do any time
def EnterLong = if close[3] < lower_Band[3] and close[2] < lower_Band[2]and close[1] < lower_Band [1] and close > lower_band then 1 else 0 ;
#
# If market open and 3 Out and 1 in then enter on bar close:
#
def EMAsInside = if lower_Band[3] < EMA8[3] and lower_Band[2] < EMA8 [2]and lower_Band[1] < EMA8[1] then 1 else 0 ;
def trigger = if isopen and EMAsInside and EnterLong then 1 else 0;
#
# Set Fixed stop loss to be ticstopLoss below previous lowest Low 5 bars back; hopefully this is the previous Swing Low
#
rec FixedStopLoss = if trigger then lowest (low,5) else FixedStopLoss[1] ;
AddOrder(OrderType.SELL_TO_CLOSE, low <= FixedStopLoss, FixedStopLoss,tradesize = 10, tickColor = Color.RED, arrowColor = Color.RED);
#
# Set Target to be ticstopLoss below upper KeltnerChannels band hopefully this is the previous Swing Low
#
def target= upper_Band - TicStopLoss;
AddOrder(OrderType.SELL_TO_CLOSE, high >= target, high,tradesize = 10, tickColor = Color.GREEN, arrowColor = Color.GREEN);
#
# Three Out One In Long Exit study
#
def na = Double.NaN;
input BarsForSwing = 5;
input NumberTicsStopLoss = 2 ;
input TicValue = 12.50 ;
def stopvalue = NumberTicsStopLoss * TicValue ; # / 100 ;
input stopunits = {default "Points", "Percent"};
def su = stopunits; #su = 0 = points
def sv = if su == 0 then stopvalue else stopvalue * close / 100.0;
input displace = 0;
input factor = 1.5;
input length = 20;
input price = close;
input averageType = AverageType.SIMPLE;
input trueRangeAverageType = AverageType.SIMPLE;
input offsetType = { percent, value, default tick};
input stopNumber = 2 ;
def entryPrice = EntryPrice();
def mult;
switch (offsetType) {
case percent:
mult = entryPrice / 100;
case value:
mult = 1;
case tick:
mult = TickSize();
} # end case
def shift = factor * MovingAverage(trueRangeAverageType, TrueRange(high, close, low), length);
def average = MovingAverage(averageType, price, length);
plot Avg = average[-displace];
Avg.SetDefaultColor(GetColor(1));
plot Upper_Band = average[-displace] + shift[-displace];
Upper_Band.SetDefaultColor(Color.RED);
plot Lower_Band = average[-displace] - shift[-displace];
Lower_Band.SetDefaultColor(Color.GREEN);
def target = Upper_Band - stopNumber * mult ; # stopvalue ;
def stop = Lower_Band - stopNumber * mult * 4; # stopvalue ;
def LowestLow = Lowest (low, BarsForSwing) ;
def StopPrice = LowestLow - stop * mult ;
def entry = if IsNaN(EntryPrice()) then 0 else 1;
def exit = if (low <= StopPrice or high >= target) then 1 else 0;
#rec plotTakeProfit= 1;
rec plotTakeProfit = if BarNumber() == 1 then 0 else if exit > 0 then 1 else if high < target then 0 else plotTakeProfit[1];
#rec plotTakeProfit = if exit > 0 then 1 else 0 ;
plot TakeProfit = if plotTakeProfit then target else na;
TakeProfit.SetDefaultColor(Color.GREEN);
TakeProfit.SetLineWeight(4);
TakeProfit.SetPaintingStrategy(PaintingStrategy.POINTS);
rec plotStopLoss = if BarNumber() == 1 then 0 else if exit > 0 then 1 else if low < stop then 0 else plotStopLoss[1];
def EMA8 =ExpAverage (close, 8) ;
def EMAsInside = if Lower_Band[3] < EMA8[3] and Lower_Band[2] < EMA8 [2] and Lower_Band[1] < EMA8[1] then 1 else 0 ;
def EntryCondition = close[3] < Lower_Band[3] and close[2] < Lower_Band[2] and close[1] < Lower_Band [1] and close > Lower_Band and EMAsInside ;
#
# The study does not have the lowest(low,5) code
#
def condition2 = If(EntryCondition and high < target, Lowest(low, 5), condition2[1]);
plot StopLossNew = condition2;
StopLossNew.SetDefaultColor(Color.RED);
StopLossNew.SetLineWeight(4);
StopLossNew.SetPaintingStrategy(PaintingStrategy.POINTS);
|
Re: Thinkscript Fixed stop Loss problem August 15, 2015 07:27PM |
Registered: 10 years ago Posts: 615 |
TraderBuddy,
This should do the trick.

- robert
Professional ThinkorSwim indicators for the average Joe
Edited 1 time(s). Last edit at 08/15/2015 07:30PM by robert.
This should do the trick.
# 3 out 1 in trading strategy
# robert payne
# [rrpayne.blogspot.com]

# change the "AmountWagered" value to be equal to the amount of money you wish to put into the trade
input AmountWagered = 3000;

# determine the number of shares to purchase based on current price and amount wagered
def tradeSize = Floor(AmountWagered / close);

# plot default keltner channel
plot Kupper = reference KeltnerChannels.upper_band;
Kupper.SetDefaultColor(Color.LIGHT_GRAY);
plot Kmid = reference KeltnerChannels.avg;
Kmid.SetDefaultColor(Color.LIGHT_GRAY);
plot Klower = reference KeltnerChannels.lower_band;
Klower.SetDefaultColor(Color.LIGHT_GRAY);

def ActiveTrade;

# long signal: 3 closes below lower band (with EMA8 in band during those 3 closes) followed by close in band
def BelowLower = close < Klower;
plot EMA8 = ExpAverage(close, 8);
def EMA8inBand = EMA8 >= Klower;
def longSignal = Sum(BelowLower[1], 3) == 3 and Sum(EMA8inBand[1], 3) == 3 and !BelowLower and !ActiveTrade[1];

# set long target price as 2 ticks below the upper keltner channel band
def target = Kupper - 2 * TickSize();

# set stop loss as lowest low for the 5 candles before long entry
def stopLoss = if longSignal then Lowest(low[1], 5) else stopLoss[1];
plot Stop_Loss = if activetrade then stoploss else double.nan;
stop_loss.setpaintingStrategy(paintingStrategy.POINTS);
stop_loss.setlineWeight(3);
stop_loss.setdefaultColor(color.pink);

# --------
ActiveTrade = CompoundValue(1, if longSignal and !ActiveTrade[1] then 1 else if high >= target or close < stopLoss then 0 else ActiveTrade[1], 0);

# enter long trade order
AddOrder(OrderType.BUY_TO_OPEN, longSignal, open[-1], tradeSize, Color.LIGHT_GREEN, Color.LIGHT_GREEN, "long @ " + Round(open[-1]));

# close long trade when target hit or if stopped out
def closeTrade = close < stopLoss or high >= target;
def exitPrice = if close < stopLoss then close else target;
AddOrder(OrderType.SELL_TO_CLOSE, closeTrade, exitPrice, tradeSize, Color.WHITE, Color.WHITE, "close long @ " + Round(exitPrice));
- robert
Professional ThinkorSwim indicators for the average Joe
Edited 1 time(s). Last edit at 08/15/2015 07:30PM by robert.
|
Re: Thinkscript Fixed stop Loss problem August 15, 2015 09:41PM |
Registered: 8 years ago Posts: 6 |
|
Re: Thinkscript Fixed stop Loss problem August 15, 2015 10:17PM |
Registered: 10 years ago Posts: 615 |
Quote
TraderBuddy
Robert,
Your code is brilliant !!
It is far simpler than what I was doing.
I have much to study.
Thanks. It's been about an 18 month learning process to get to where I am now.
Quote
TraderBuddy
I will buy you a lunch or two ...
Thank you so much. I really appreciate it.
- robert
Professional ThinkorSwim indicators for the average Joe
|
Re: Fun with ThinkScript August 20, 2015 09:45PM |
Registered: 8 years ago Posts: 59 |
Robert, I'm having a problem with some scripts. If I put a script on a chart using Add Label and the chart is set to start at the open the script works correctly right from the open. When I use it in a Watch List it's a different story.
If the range script below is used in a Watch List it takes a while for it to give the right value. I believe it's calculating using the previous day's values;
Plot R = (close - lowest(low, 30)) - (close - Highest(High, 30));
How can I write the script so it will start in a Watch List correctly at the open? Thank you so much.
Edited 1 time(s). Last edit at 08/20/2015 11:21PM by Ralph53.
|
Re: Fun with ThinkScript August 20, 2015 11:55PM |
Registered: 10 years ago Posts: 615 |
Ralph53,
I see nothing wrong with your code. I believe the problem lies with the way the custom watchlist columns work. I don't trust them for real-time data. See this post for one example.
Here's another simple example.
Put this extremely basic script into a custom column to calculate the net change in price. Leave the aggregation period set to the default "D" (daily) value.
If you look at the column when the market is closed, the numbers will exactly match the built-in net change indicator as may be seen below.

However, if you look at that same custom column during live market hours, you'll see that the numbers almost never match up because they always seem to be delayed by several minutes. Because of that, I don't use the custom watchlist columns for any information that I want to see in real-time. I always put it in a label on the charts themselves because those do update in real-time.
- robert
Professional ThinkorSwim indicators for the average Joe
I see nothing wrong with your code. I believe the problem lies with the way the custom watchlist columns work. I don't trust them for real-time data. See this post for one example.
Here's another simple example.
Put this extremely basic script into a custom column to calculate the net change in price. Leave the aggregation period set to the default "D" (daily) value.
plot NetChg = close - close[1];
If you look at the column when the market is closed, the numbers will exactly match the built-in net change indicator as may be seen below.
However, if you look at that same custom column during live market hours, you'll see that the numbers almost never match up because they always seem to be delayed by several minutes. Because of that, I don't use the custom watchlist columns for any information that I want to see in real-time. I always put it in a label on the charts themselves because those do update in real-time.
- robert
Professional ThinkorSwim indicators for the average Joe


Sorry, only registered users may post in this forum.
Trade with Knowledge, Trade with Power - ResearchTrade.com.