Fun with ThinkScript
Posted by robert
|
Re: Fun with ThinkScript April 09, 2020 01:50PM |
Registered: 4 years ago Posts: 1 |
Hello....new member, and first time poster as well...with a question/request similar but slightly different than Aaron's just above (I think), so I hope I'm not duplicating requests.
My question/request is wrt creating an alert that would notify me when there are "X" amount of red or green candles in a row on a given timeframe, that would set off an audible tone notifying me of the event. For instance - six green candles in a row - "DING!".....and/or - two red candles in a row - "DING!" (or "BING!" if it's possible to have a different tone for each color event).
This would hopefully be active/available on any chart I'm looking at in whatever timeframe I might have up...possibly a candle counting indicator with an alert/alarm on it when it hits the specified number of red or green candles in a row. Yes, I know there could be a lot of "DINGing" and "BINGing" going on depending on timeframe and candle count, but I'm willing to see how my sanity might be effected...at least for the time being. Lol...
Thanks in advance.
|
scan last 3 candlesticks are up April 12, 2020 07:50AM |
Registered: 7 years ago Posts: 126 |
|
Re: Fun with ThinkScript April 15, 2020 11:27PM |
Registered: 5 years ago Posts: 8 |
|
Re: Fun with ThinkScript April 16, 2020 05:03PM |
Registered: 4 years ago Posts: 2 |
|
Re: Fun with ThinkScript April 21, 2020 07:41AM |
Registered: 4 years ago Posts: 1 |
|
Re: Fun with ThinkScript May 03, 2020 02:14PM |
Registered: 3 years ago Posts: 2 |
Hey,
Need some help finding a value in the past, and drawing a horizontal line from it. I have searched about 50 pages to get any idea and have learned how to plot a line from a high bar but haven't figured out how to in relation to time. What I want to do is based off a scan from stockfetcher. Ultimately I want to make a TOS scan from it but it think the study would be useful to visualize.
[www.stockfetcher.com]
The study will find a 10 days high within 10 days and the 20 day high within 60 days and calculates the value if a line connected the two highs to today. The condition is when the price crosses above that calculated value*.
So from my little knowledge of coding I have been playing around with
highest(high[10], 100); and
getvalue to find the point
how off is this?
edit:
Found something on page 70 or 71? that may help. Unfortunately it looks like its only part of a code, but now I realize I need to def some time.
Edited 1 time(s). Last edit at 05/03/2020 02:57PM by Ken_Adams.
|
Re: Fun with ThinkScript May 07, 2020 01:09AM |
Registered: 3 years ago Posts: 1 |
Hi Robert,
Glad to have found this site. I see you are quite the expert with Thinkscript. I was wondering if you would be able to provide a script that labels each bar with a numerical value depending on these criteria. 1= inside bar with color of yellow, 2= regular bars with their default colors, 3 = outside bar and colored white. It is shown used below in the screenshot. Try as I may, google could not find this particular script.
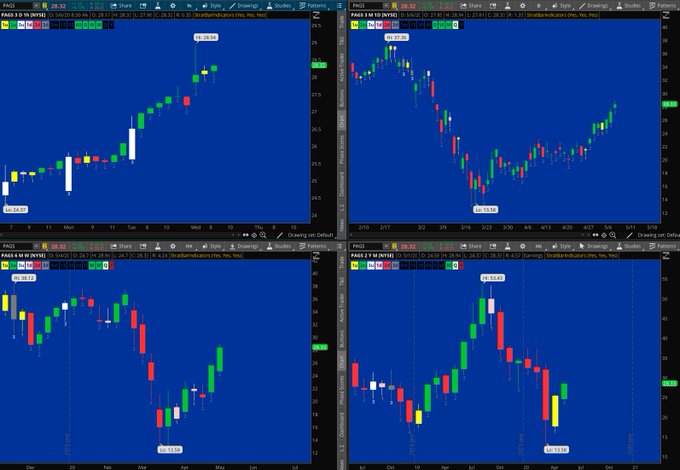
The script also provides a secondary status as shown on top left corner of each quadrant. It displays the color of the last bar for each timeframe 60 min, Daily, Weekly, Monthly. Green, Red, White or Yellow depending on type of bar it is.
I'd be willing to pay a small fee for your work. Thanks in advance for your assistance.
Glad to have found this site. I see you are quite the expert with Thinkscript. I was wondering if you would be able to provide a script that labels each bar with a numerical value depending on these criteria. 1= inside bar with color of yellow, 2= regular bars with their default colors, 3 = outside bar and colored white. It is shown used below in the screenshot. Try as I may, google could not find this particular script.
The script also provides a secondary status as shown on top left corner of each quadrant. It displays the color of the last bar for each timeframe 60 min, Daily, Weekly, Monthly. Green, Red, White or Yellow depending on type of bar it is.
I'd be willing to pay a small fee for your work. Thanks in advance for your assistance.
|
Re: Fun with ThinkScript May 08, 2020 11:50AM |
Registered: 6 years ago Posts: 2 |
Hi Robert,
I found this study for "Point and Figure" on the web (Amibroker). Was wondering if this can be converted to Thinkscript.
Here is the code below:
_SECTION_BEGIN("PnF & Values" ;
;
( "Point & Figure w Values adj" );
GraphXSpace = 5;
//SetChartBkColor( ParamColor( "BackGroundColor", colorBlack) );
//GraphColor = ParamColor("GarphColor",colorLightGrey);
GridColor = ParamColor( "GridColor", colorLightGrey );
Scaling = ParamList( "Scaling Method", "Traditional|Percentage|AVG True Range"
);
if ( scaling == "Traditional" )
Box = Param( "Box Size", 1, 0.1, 10, 0.1 );
else
if ( scaling == "Percentage" )
Box = Param( "Box Size", 1, 0.1, 10, 0.1 ) / 100 * LastValue( C );
else
if ( scaling == "AVG True Range" )
Box = Param( "Box Size", 1, 0.1, 5, 0.1 ) * LastValue( ATR ( 20 ) );
shiftChart = 0;
shiftLastClose = 1;
shiftGrid = 7;
shiftPriceAxis = 2;
Reverse = Param( "Reverse", 3, 1, 5 );
j = 0;
PFL[0] = Box * ceil( Low[0] / Box ) + Box;
PFH[0] = Box * floor( High[0] / Box );
direction = 0;
for ( i = 1; i < BarCount; i++ )
{
if ( direction[j] == 0 )
{
if ( Low <= PFL[j] - Box )
{
PFL[j] = Box * ceil( Low / Box );
}
else
{
if ( High >= PFL[j] + Reverse*Box )
{
j++;
direction[j] = 1;
PFH[j] = Box * floor( High / Box );
PFL[j] = PFL[j - 1] + Box;
}
}
}
else
{
if ( High >= PFH[j] + Box )
{
PFH[j] = Box * floor( High / Box );
}
else
{
if ( Low <= PFH[j] - Reverse * Box )
{
j++;
direction[j] = 0;
PFH[j] = PFH[j - 1] - Box;
PFL[j] = Box * ceil( Low / Box );
}
}
}
}
delta = BarCount - j - 1;
direction = Ref( direction, - delta );
Hi = Ref( PFH, -delta ) + Box / 2;
Lo = Ref( PFL, -delta ) - Box / 2;
Cl = IIf( direction == 1, Hi, Lo );
Op = IIf( direction == 1, Cl - Box, Cl + Box );
Graphcolor = IIf( direction == 1, ParamColor( "X_Color", colorBrightGreen ),
ParamColor( "O_Color", colorRed ) );
PlotOHLC( Op, Hi, Lo, Cl, "", GraphColor ,
stylePointAndFigure | styleNoLabel, 0, 0 , shiftChart );
PlotOHLC( Op, Hi, Lo, Cl, "", GraphColor , stylePointAndFigure | styleNoLabel,
0, 0 , shiftChart );
Last = Ref( LastValue( C ), -( BarCount - 1 ) );
Plot( Last, "", colorRed, styleNoLine | styleDots, 0 , 0, shiftLastClose );
// selected value
Value = IIf( direction > 0, SelectedValue( Hi ) - box / 2, SelectedValue( Lo )
+ box / 2 );
//-----------------------------------------------------------------------
// GRID CONSTRUCTION
//----------------------------------------------------------------------
PlotGridLines = ParamToggle( "PlotdGrid", "Yes! |No", 1 ) ;
if ( PlotGridLines )
{
begin = SelectedValue( BarIndex() );
end = LastValue( BarIndex() );
period = end - begin + 1;
if ( begin < end )
{
ScreenHigh = LastValue( HHV( cl, period ) );
ScreenLow = LastValue( LLV( Cl, period ) );
top = LineArray( begin - shiftGrid, screenHigh, end, screenhigh, 0 , 1 );
Bot = LineArray( begin - shiftGrid, screenlow, end, screenLow, 0, 1 );
Plot( top, "", gridColor, styleLine | styleNoLabel , 0, 0, shiftGrid );
//Plot( bot, "", gridColor,styleLine|styleNoLabel, 0 , 0 , shiftGrid);
VerticalGrid = IIf ( BarIndex() >= begin, IIf( direction == 1, screenHigh,
screenLow ), Null );
Plot ( VerticalGrid, "", gridColor, styleStaircase | styleNoLabel, 0, 0, 1 );
format = 8.2;
for ( n = LastValue( bot ); n < LastValue( top ) - 0.5*box; n = n + box )
{
Plot( bot , "", gridColor, styleLine | styleNoLabel, 0, 0 , shiftGrid );
text = NumToStr( LastValue( bot ) + 0.5 * box, format );
xposition = BarCount + shiftPriceaxis;
yPosition = LastValue( bot ) + 0.27 * box;
PlotText( text, xPosition , yPosition, colorBlue );
bot = bot + box;
Graphcolor = IIf( direction == 1, ParamColor( "X_Color", colorBrightGreen ),
ParamColor( "O_Color", colorRed ) );
PlotOHLC( Op, Hi, Lo, Cl, "", GraphColor ,
stylePointAndFigure | styleNoLabel, 0, 0 , shiftChart );
}
}
}
//---------------------------------------------------------------------
// TITLE
//----------------------------------------------------------------------
Title = "\n" +
" Instrument: " + Name() + FullName() + "\n " +
"Industry: " + IndustryID(1) + "\n " +
//"Formula : " + " Point & Figure (High/Low Range)" + "\n " +
"Formula: " + Scaling + "\n " +
"Box: " + NumToStr( Box, 4.4 ) + " " +
"Reverse: " + NumToStr( Reverse, 2.0 )+ "\n "
+ Interval(2) + " Chart";
// + "\n " + "ATR : " + WriteVal( LastValue( ATR( 100 ) ), format = 4.4 );
_SECTION_END();
_SECTION_END();
////////////////////////////////////////////////////////////////////////////////////
_SECTION_BEGIN("Background";
SetChartOptions(0,chartShowDates|chartShowArrows);
// Tool Tip Popup Window
if( ParamToggle("Tooltip shows", "All Values|Only Prices" ) )
{
ToolTip=StrFormat("Open: %g\nHigh: %g\nLow: %g\nClose: %g
(%.1f%%)\nVolume: "+NumToStr( V, 1 ), O, H, L, C, SelectedValue( ROC( C, 1
)));
}
SetChartOptions(0,chartShowDates|chartShowArrows);
// Right and Bottom Panel Color
SetChartBkColor(ParamColor("Outer panel color ",colorLightGrey)); // color of outer border
// Background Gradient Colors
SetChartBkGradientFill( ParamColor("Inner panel color upper half",colorGrey50),
ParamColor("Inner panel color lower half",colorGrey50)); //color of inner panel
_SECTION_END();
////////////////////////////////////////////////////////////////////////////////////
////////////////////////////////////////////////////////////////////////////////////
_SECTION_BEGIN("Watermark";
//SetChartBkColor(5) ;
GfxSetOverlayMode(1);
GfxSetTextAlign( 6 );// center alignment
//GfxSetTextColor( ColorRGB( 22, 45, 149 ) );
//GfxSetTextColor( ColorRGB( 67, 60, 114 ) );
GfxSetTextColor( ColorRGB( 200, 200, 200 ) );
GfxSetTextColor( ColorHSB( 42, 42, 42 ) );
GfxSetBkMode(0); // transparent
GfxTextOut( IndustryID(1), Status("pxwidth"/2, Status("pxheight"/4 );
// Text Label 1
GfxSelectFont("Tahoma", Status("pxheight"/6 );
GfxTextOut( Name(), Status("pxwidth"/2, Status("pxheight"/12 );
// Text Label 2
GfxSelectFont("Tahoma", Status("pxheight"/12 );
GfxTextOut( " ", Status("pxwidth"/2, Status("pxheight"/3 );
// Text Label 3
GfxSelectFont("Tahoma", Status("pxheight"/36 );
GfxTextOut( " ", Status("pxwidth"/2, Status("pxheight"/2 );
_SECTION_END();
////////////////////////////////////////////////////////////////////////////////////
------------------
Be willing to know if this can be done? Thank you so much for any response.
I found this study for "Point and Figure" on the web (Amibroker). Was wondering if this can be converted to Thinkscript.
Here is the code below:
_SECTION_BEGIN("PnF & Values"
;
( "Point & Figure w Values adj" );
GraphXSpace = 5;
//SetChartBkColor( ParamColor( "BackGroundColor", colorBlack) );
//GraphColor = ParamColor("GarphColor",colorLightGrey);
GridColor = ParamColor( "GridColor", colorLightGrey );
Scaling = ParamList( "Scaling Method", "Traditional|Percentage|AVG True Range"
);
if ( scaling == "Traditional" )
Box = Param( "Box Size", 1, 0.1, 10, 0.1 );
else
if ( scaling == "Percentage" )
Box = Param( "Box Size", 1, 0.1, 10, 0.1 ) / 100 * LastValue( C );
else
if ( scaling == "AVG True Range" )
Box = Param( "Box Size", 1, 0.1, 5, 0.1 ) * LastValue( ATR ( 20 ) );
shiftChart = 0;
shiftLastClose = 1;
shiftGrid = 7;
shiftPriceAxis = 2;
Reverse = Param( "Reverse", 3, 1, 5 );
j = 0;
PFL[0] = Box * ceil( Low[0] / Box ) + Box;
PFH[0] = Box * floor( High[0] / Box );
direction = 0;
for ( i = 1; i < BarCount; i++ )
{
if ( direction[j] == 0 )
{
if ( Low <= PFL[j] - Box )
{
PFL[j] = Box * ceil( Low / Box );
}
else
{
if ( High >= PFL[j] + Reverse*Box )
{
j++;
direction[j] = 1;
PFH[j] = Box * floor( High / Box );
PFL[j] = PFL[j - 1] + Box;
}
}
}
else
{
if ( High >= PFH[j] + Box )
{
PFH[j] = Box * floor( High / Box );
}
else
{
if ( Low <= PFH[j] - Reverse * Box )
{
j++;
direction[j] = 0;
PFH[j] = PFH[j - 1] - Box;
PFL[j] = Box * ceil( Low / Box );
}
}
}
}
delta = BarCount - j - 1;
direction = Ref( direction, - delta );
Hi = Ref( PFH, -delta ) + Box / 2;
Lo = Ref( PFL, -delta ) - Box / 2;
Cl = IIf( direction == 1, Hi, Lo );
Op = IIf( direction == 1, Cl - Box, Cl + Box );
Graphcolor = IIf( direction == 1, ParamColor( "X_Color", colorBrightGreen ),
ParamColor( "O_Color", colorRed ) );
PlotOHLC( Op, Hi, Lo, Cl, "", GraphColor ,
stylePointAndFigure | styleNoLabel, 0, 0 , shiftChart );
PlotOHLC( Op, Hi, Lo, Cl, "", GraphColor , stylePointAndFigure | styleNoLabel,
0, 0 , shiftChart );
Last = Ref( LastValue( C ), -( BarCount - 1 ) );
Plot( Last, "", colorRed, styleNoLine | styleDots, 0 , 0, shiftLastClose );
// selected value
Value = IIf( direction > 0, SelectedValue( Hi ) - box / 2, SelectedValue( Lo )
+ box / 2 );
//-----------------------------------------------------------------------
// GRID CONSTRUCTION
//----------------------------------------------------------------------
PlotGridLines = ParamToggle( "PlotdGrid", "Yes! |No", 1 ) ;
if ( PlotGridLines )
{
begin = SelectedValue( BarIndex() );
end = LastValue( BarIndex() );
period = end - begin + 1;
if ( begin < end )
{
ScreenHigh = LastValue( HHV( cl, period ) );
ScreenLow = LastValue( LLV( Cl, period ) );
top = LineArray( begin - shiftGrid, screenHigh, end, screenhigh, 0 , 1 );
Bot = LineArray( begin - shiftGrid, screenlow, end, screenLow, 0, 1 );
Plot( top, "", gridColor, styleLine | styleNoLabel , 0, 0, shiftGrid );
//Plot( bot, "", gridColor,styleLine|styleNoLabel, 0 , 0 , shiftGrid);
VerticalGrid = IIf ( BarIndex() >= begin, IIf( direction == 1, screenHigh,
screenLow ), Null );
Plot ( VerticalGrid, "", gridColor, styleStaircase | styleNoLabel, 0, 0, 1 );
format = 8.2;
for ( n = LastValue( bot ); n < LastValue( top ) - 0.5*box; n = n + box )
{
Plot( bot , "", gridColor, styleLine | styleNoLabel, 0, 0 , shiftGrid );
text = NumToStr( LastValue( bot ) + 0.5 * box, format );
xposition = BarCount + shiftPriceaxis;
yPosition = LastValue( bot ) + 0.27 * box;
PlotText( text, xPosition , yPosition, colorBlue );
bot = bot + box;
Graphcolor = IIf( direction == 1, ParamColor( "X_Color", colorBrightGreen ),
ParamColor( "O_Color", colorRed ) );
PlotOHLC( Op, Hi, Lo, Cl, "", GraphColor ,
stylePointAndFigure | styleNoLabel, 0, 0 , shiftChart );
}
}
}
//---------------------------------------------------------------------
// TITLE
//----------------------------------------------------------------------
Title = "\n" +
" Instrument: " + Name() + FullName() + "\n " +
"Industry: " + IndustryID(1) + "\n " +
//"Formula : " + " Point & Figure (High/Low Range)" + "\n " +
"Formula: " + Scaling + "\n " +
"Box: " + NumToStr( Box, 4.4 ) + " " +
"Reverse: " + NumToStr( Reverse, 2.0 )+ "\n "
+ Interval(2) + " Chart";
// + "\n " + "ATR : " + WriteVal( LastValue( ATR( 100 ) ), format = 4.4 );
_SECTION_END();
_SECTION_END();
////////////////////////////////////////////////////////////////////////////////////
_SECTION_BEGIN("Background"
;
SetChartOptions(0,chartShowDates|chartShowArrows);
// Tool Tip Popup Window
if( ParamToggle("Tooltip shows", "All Values|Only Prices" ) )
{
ToolTip=StrFormat("Open: %g\nHigh: %g\nLow: %g\nClose: %g
(%.1f%%)\nVolume: "+NumToStr( V, 1 ), O, H, L, C, SelectedValue( ROC( C, 1
)));
}
SetChartOptions(0,chartShowDates|chartShowArrows);
// Right and Bottom Panel Color
SetChartBkColor(ParamColor("Outer panel color ",colorLightGrey)); // color of outer border
// Background Gradient Colors
SetChartBkGradientFill( ParamColor("Inner panel color upper half",colorGrey50),
ParamColor("Inner panel color lower half",colorGrey50)); //color of inner panel
_SECTION_END();
////////////////////////////////////////////////////////////////////////////////////
////////////////////////////////////////////////////////////////////////////////////
_SECTION_BEGIN("Watermark"
;
//SetChartBkColor(5) ;
GfxSetOverlayMode(1);
GfxSetTextAlign( 6 );// center alignment
//GfxSetTextColor( ColorRGB( 22, 45, 149 ) );
//GfxSetTextColor( ColorRGB( 67, 60, 114 ) );
GfxSetTextColor( ColorRGB( 200, 200, 200 ) );
GfxSetTextColor( ColorHSB( 42, 42, 42 ) );
GfxSetBkMode(0); // transparent
GfxTextOut( IndustryID(1), Status("pxwidth"
/2, Status("pxheight"/4 );
// Text Label 1
GfxSelectFont("Tahoma", Status("pxheight"
/6 );
GfxTextOut( Name(), Status("pxwidth"
/2, Status("pxheight"/12 );
// Text Label 2
GfxSelectFont("Tahoma", Status("pxheight"
/12 );
GfxTextOut( " ", Status("pxwidth"
/2, Status("pxheight"/3 );
// Text Label 3
GfxSelectFont("Tahoma", Status("pxheight"
/36 );
GfxTextOut( " ", Status("pxwidth"
/2, Status("pxheight"/2 );
_SECTION_END();
////////////////////////////////////////////////////////////////////////////////////
------------------
Be willing to know if this can be done? Thank you so much for any response.
|
Re: Fun with ThinkScript May 08, 2020 11:52AM |
Registered: 6 years ago Posts: 2 |
|
Help on Think Script May 10, 2020 07:49AM |
Registered: 3 years ago Posts: 1 |
Hi Everyone,
I am a complete newbie in thinkscript and coding. I have just started learning about it few days ago and I am stuck in alot of ways. Hope someone is able to guide me on this.
Firstly, I am trying to code an add order function of SELL_TO_CLOSE but have no clue on how to do it.
What I am trying to do is after a buy to open signal, if the low of a bar in the future is less than or equals to the low of the bar before the entry bar, exit at the low of the bar before the entry bar.
Would appreciate an answer to this as I have been thinking about it for sometimes!! Thank you lots!
CHEERS,
Peng Joon
|
Re:Help Convert PineScript to ThinkScript May 15, 2020 05:40PM |
Registered: 6 years ago Posts: 1 |
Hi, Wondering if someone can help converting the following script from tradingview to thinkscript:
//@version=4
study("Pivot Point SuperTrend", overlay = true)
prd = input(defval = 2, title="Pivot Point Period", minval = 1, maxval = 50)
Factor=input(defval = 3, title = "ATR Factor", minval = 1, step = 0.1)
Pd=input(defval = 10, title = "ATR Period", minval=1)
showpivot = input(defval = false, title="Show Pivot Points"
showlabel = input(defval = true, title="Show Buy/Sell Labels"
showcl = input(defval = false, title="Show PP Center Line"
showsr = input(defval = false, title="Show Support/Resistance"
float ph = na
float pl = na
ph := pivothigh(prd, prd)
pl := pivotlow(prd, prd)
plotshape(ph and showpivot, text="H", style=shape.labeldown, color=na, textcolor=color.red, location=location.abovebar, transp=0, offset = -prd)
plotshape(pl and showpivot, text="L", style=shape.labeldown, color=na, textcolor=color.lime, location=location.belowbar, transp=0, offset = -prd)
float center = na
center := center[1]
float lastpp = ph ? ph : pl ? pl : na
if lastpp
if na(center)
center := lastpp
else
center := (center * 2 + lastpp) / 3
Up = center - (Factor * atr(Pd))
Dn = center + (Factor * atr(Pd))
float TUp = na
float TDown = na
Trend = 0
TUp := close[1] > TUp[1] ? max(Up, TUp[1]) : Up
TDown := close[1] < TDown[1] ? min(Dn, TDown[1]) : Dn
Trend := close > TDown[1] ? 1: close < TUp[1]? -1: nz(Trend[1], 1)
Trailingsl = Trend == 1 ? TUp : TDown
linecolor = Trend == 1 and nz(Trend[1]) == 1 ? color.lime : Trend == -1 and nz(Trend[1]) == -1 ? color.red : na
plot(Trailingsl, color = linecolor , linewidth = 2, title = "PP SuperTrend"
plot(showcl ? center : na, color = showcl ? center < hl2 ? color.blue : color.red : na, transp = 0)
bsignal = Trend == 1 and Trend[1] == -1
ssignal = Trend == -1 and Trend[1] == 1
plotshape(bsignal and showlabel ? Trailingsl : na, title="Buy", text="Buy", location = location.absolute, style = shape.labelup, size = size.tiny, color = color.lime, textcolor = color.black, transp = 0)
plotshape(ssignal and showlabel ? Trailingsl : na, title="Sell", text="Sell", location = location.absolute, style = shape.labeldown, size = size.tiny, color = color.red, textcolor = color.white, transp = 0)
float resistance = na
float support = na
support := pl ? pl : support[1]
resistance := ph ? ph : resistance[1]
plot(showsr and support ? support : na, color = showsr and support ? color.lime : na, style = plot.style_circles, offset = -prd)
plot(showsr and resistance ? resistance : na, color = showsr and resistance ? color.red : na, style = plot.style_circles, offset = -prd)
alertcondition(Trend == 1 and Trend[1] == -1, title='Buy Signal', message='Buy Signal')
alertcondition(Trend == -1 and Trend[1] == 1, title='Sell Signal', message='Sell Signal')
alertcondition(change(Trend), title='Trend Changed', message='Trend Changed')
Thanks
Lukhy11
|
Re: Fun with ThinkScript June 03, 2020 02:24PM |
Registered: 3 years ago Posts: 2 |
Good day friends
who can help ???. this formula shows in the list where the price is now .. above or below VWAP .... is it possible to add a signal to the intersection of VWAP in cents in this script ... that is, to display stocks that crossed VWAP for a certain impulse in cents ... ..search for one bar at the intersection of VWAP for a certain number of cents.
plot vwap = vwap (); AssignBackgroundColor (if close> vwap then Color.DARK_GREEN else if close <vwap then Color.DARK_RED else Color.Dark_ORANGE
|
Re: Fun with ThinkScript June 05, 2020 01:06PM |
Registered: 3 years ago Posts: 2 |
Good day to everyone.
Help to insert a sound signal when an arrow appears.
Thank you
## START STUDY
## Anchored_VWAP2
## linus, 2014-03-10, v0.1
#10:24 linus: it carries over the previous pivot's lines for high, low and close. (it plots vwaps of the high, low and close that are reset each time a new pivot is found.)
#10:25 linus: i wrote it to experiment with vwap as stops. (the high and low vwaps that can be offset by the ticks input.)
#10:25 linus: but it should serve as an example of how to reset the vwaps based on a signal.
#10:35 linus: #hint: VWAP stops anchored off fractalTrader pivots.
#10:37 linus: the code calculates the pivots as PivH and PivL, and then restarts the high, low and close vwaps when it finds a new pivot. Otherwise it continues to calculate the high, low and close vwaps.
#10:37 linus: the dashed vwap plots are the saved from the previous pivot, and the solid vwap plots are since the last pivot.
#hint: VWAP stops anchored off fractalTrader pivots.
#hint n: Lookback period for finding swing highs, lows.
input n = 20;
#hint ticks: Offset High/Low VWAP lines by this number of ticks.
input ticks = 2.0;
def bnOK = barNumber() > n;
def isHigher = fold i = 1 to n + 1 with p = 1
while p do high > GetValue(high, -i);
def HH = if bnOK and isHigher
and high == Highest(high, n)
then high else Double.NaN;
def isLower = fold j = 1 to n + 1 with q = 1
while q do low < GetValue(low, -j);
def LL = if bnOK and isLower
and low == Lowest(low, n)
then low else Double.NaN;
def PivH = if HH > 0 then HH else Double.NaN;
def PivL = if LL > 0 then LL else Double.NaN;
plot Up = !isNaN(PivL);
Up.SetPaintingStrategy(PaintingStrategy.BOOLEAN_ARROW_UP);
Up.SetLineWeight(3);
Up.SetDefaultColor(Color.WHITE);
plot Dn = !isNaN(PivH);
Dn.SetPaintingStrategy(PaintingStrategy.BOOLEAN_ARROW_DOWN);
Dn.SetLineWeight(3);
Dn.SetDefaultColor(Color.ORANGE);
def LocH = (high + (tickSize() * ticks)) * volume;
def LocL = (low - (tickSize() * ticks)) * volume;
def LocC = close * volume;
rec PC;
rec VC;
rec PC2;
rec VC2;
rec PH;
rec VH;
rec PL;
rec VL;
rec PH2;
rec VH2;
rec PL2;
rec VL2;
if Dn or Up {
PC = LocC;
VC = volume;
PC2 = PC[1];
VC2 = VC[1];
} else {
PC = compoundValue(1, LocC + PC[1], Double.NaN);
VC = compoundValue(1, volume + VC[1], Double.NaN);
PC2 = compoundValue(1, LocC + PC2[1], Double.NaN);
VC2 = compoundValue(1, volume + VC2[1], Double.NaN);
}
if Dn {
PH = LocH;
VH = volume;
PH2 = PH[1];
VH2 = VH[1];
} else {
PH = compoundValue(1, LocH + PH[1], Double.NaN);
VH = compoundValue(1, volume + VH[1], Double.NaN);
PH2 = compoundValue(1, LocH + PH2[1], Double.NaN);
VH2 = compoundValue(1, volume + VH2[1], Double.NaN);
}
if Up {
PL = LocL;
VL = volume;
PL2 = PL[1];
VL2 = VL[1];
} else {
PL = compoundValue(1, LocL + PL[1], Double.NaN);
VL = compoundValue(1, volume + VL[1], Double.NaN);
PL2 = compoundValue(1, LocL + PL2[1], Double.NaN);
VL2 = compoundValue(1, volume + VL2[1], Double.NaN);
}
plot VwapC = if Dn or Up then Double.NaN else PC / VC;
plot VwapC2 = if Dn or Up then Double.NaN else PC2 / VC2;
plot VwapH = if Dn then Double.NaN else PH / VH;
plot VwapL = if Up then Double.NaN else PL / VL;
plot VwapH2 = if Dn then Double.NaN else PH2 / VH2;
plot VwapL2 = if Up then Double.NaN else PL2 / VL2;
VwapC.SetDefaultColor(Color.YELLOW);
VwapC.SetLineWeight(2);
VwapC.HideBubble();
VwapC2.SetDefaultColor(Color.YELLOW);
VwapC2.SetLineWeight(2);
VwapC2.SetStyle(Curve.SHORT_DASH);
VwapC2.HideBubble();
VwapH.SetDefaultColor(Color.DARK_RED);
VwapH.HideBubble();
VwapL.SetDefaultColor(Color.DARK_GREEN);
VwapL.HideBubble();
VwapH2.SetDefaultColor(Color.DARK_RED);
VwapH2.SetStyle(Curve.SHORT_DASH);
VwapH2.HideBubble();
VwapL2.SetDefaultColor(Color.DARK_GREEN);
VwapL2.SetStyle(Curve.SHORT_DASH);
VwapL2.HideBubble();
## END STUDY
will it be right ??
Code:
alert(PivL,”Signal BUY”,alert.BAR,Sound.Bell);
alert(PivH,”Signal Sell”,alert.BAR,sound.DING);
Edited 1 time(s). Last edit at 06/05/2020 01:26PM by evolernet.
|
DINAPOLI INDICATORS June 07, 2020 03:49AM |
Registered: 3 years ago Posts: 1 |
Hello Robert. Very new at this. Some time ago i bought the Dinapoli package for tradestation and it worked great. But now that I’m using Thinkorswim i have not been able to access those indicators. Dinapoli does not support TOS. I have searched everywhere i know for the Thinskscript for the Dinapoli levels (fibnodes) and the Leading indicators but have not been successful. Would you be able to provide the TS code for those indicators? Or maybe you know where i can access it. Thank you much in advance.
MOP
MOP
|
Re: Fun with ThinkScript June 12, 2020 03:59PM |
Registered: 9 years ago Posts: 26 |
Hello All,
I was wondering if somewhere in this thread there is a script to scan for Gary's DMI to see when the red or green is below 10 and looking for a reversal?
Thanks
Or it could be in the watch list, just something to give me a heads up to start watching for the reversal.
Thank you
Edited 1 time(s). Last edit at 06/15/2020 05:02PM by PastorP.
|
How to say if 3 out 5 conditions are true show signal? June 16, 2020 12:07PM |
Registered: 9 years ago Posts: 34 |
Hi,
I am having trouble figuring out whats the most efficient way to code the following.
For example:
we have defined 4 conditions now I want to show a signal when 3 out of 4 conditions are true. I was thinking if statements but couldn't figure how the logic will look like because the order of the conditions being true in not linear.
Thank You.
|
Re: Fun with ThinkScript June 16, 2020 08:08PM |
Registered: 3 years ago Posts: 1 |
Not my code, but it will do what you want...
#squeeze momentum histogram only
declare lower;
def K = (Highest(High, length) + Lowest(low, length)) /
2 + ExpAverage(close, length);
plot Momo = Inertia(close - K / 2, length);
Momo.setPaintingStrategy(PaintingStrategy.HISTOGRAM);
Momo.setLineWeight(3);
Momo.assignValueColor(if Momo > Momo[1] and Momo > 0
then Color.Cyan
else if Momo > 0 and Momo < Momo[1]
then Color.Blue
else if Momo < 0 and Momo < Momo[1]
then Color.Red
else Color.Yellow);
Edited 1 time(s). Last edit at 06/16/2020 08:09PM by JT07.
|
Re: How to say if 3 out 5 conditions are true show signal? June 23, 2020 09:11AM |
Registered: 7 years ago Posts: 126 |
try something like this in your code:
def cond1= if whatever then 1 else 0;
def cond2= if whatever then 1 else 0;
def cond3= if whatever then 1 else 0;
def cond4= if whatever then 1 else 0;
def cond5= if whatever then 1 else 0;
def status=cond1+cond2+cond3+cond4+cond5;
Def mysignal= if status >=3 then yes else no;
def cond1= if whatever then 1 else 0;
def cond2= if whatever then 1 else 0;
def cond3= if whatever then 1 else 0;
def cond4= if whatever then 1 else 0;
def cond5= if whatever then 1 else 0;
def status=cond1+cond2+cond3+cond4+cond5;
Def mysignal= if status >=3 then yes else no;
|
Re: Fun with ThinkScript July 12, 2020 10:24PM |
Registered: 3 years ago Posts: 1 |
|
robert's minor & major waves July 14, 2020 04:40AM |
Registered: 4 years ago Posts: 3 |
Can someone help me please, I am fairly new to thinkscript. I play with it on or off when I get a chance. I would like to create robert’s creation MINOR ( SQUARES ) & MAJOR ( TRIANGLES ) waves, but I am confused. I never used and I don’t understand the switch. Especially the back and forth conversation mentioned on page 64. Can someone kindly provide me the COMPLETED script and a brief explanation on how it works. Thank you
|
robert's minor & major waves July 14, 2020 04:33AM |
Registered: 4 years ago Posts: 3 |
Can someone help me please, I am fairly new to thinkscript. I play with it on or off when I get a chance. I would like to create robert’s creation MINOR ( SQUARES ) and MAJOR ( TRIANGLES )waves, but I am confused. I never used and I don’t understand the switch. Especially the back and forth conversation mentioned on page 64. Can someone kindly provide me the COMPLETED script and a brief explanation on how it works. Thank you
|
Re: Fun with ThinkScript July 15, 2020 07:29AM |
Registered: 3 years ago Posts: 1 |
|
Re: Fun with ThinkScript July 17, 2020 12:34PM |
Registered: 3 years ago Posts: 1 |
Bullish View
Buy Entry conditions
1. On D1 or H4 Chart - Kijun Sen and (SSA or SS should move up AND
2. On H1 chart – Kijun Sen and (SSA or SS should move up AND
3. On M5
a.if there is a squeeze breakout or
b.Stochastic(30,10,10) gold cross happening below 50
Close or Exit conditions
1. On D1 or H4 Chart - when Kijun Sen becomes flat OR
2. On H1 - when Kijun Sen becomes flat OR
3. When close is less than or equal to 1% of the entry price OR
4. On M5
a.If there is a close below the lower Bollinger Band (20,2) OR
b.Stochastic(30,10,10) Dead cross
Bearish View
Sell Entry conditions
1) On D1 or H4 chart – Kijun Sen and ( SSA or SS should move Down AND
2) On H1 chart – Kijun Sen and (SSA or SS should move Down AND
3) On M5
a)if there is a squeeze breakdown or
b)Stochastic(30,10,10) Dead cross happening above 50
Close or Exit conditions
1) On D1 or H4 Chart - when Kijun Sen becomes flat OR
2) On H1 - when Kijun Sen becomes flat OR
3) When close is more than or equal to 1% of the entry price OR
4) On M5
a) If there is a close above the upper Bollinger Band (20,2) OR
b) Stochastic(30,10,10) Gold cross
Note1: Squeeze means when Bollinger Bands(20,2) falls into the Keltner Channels (20,1.5,10)
Note2:H1 = one hour chart, Day1=Daily chart, M5 = 5 Minute chart
Note3: I will be looking on 5 minute chart to take entries.
Note4: All entries (Bullish/ Bearish) need to be different color code.
Note5: P/L need to be shown at the bottom of the chart M5.
Note6: I will be back testing this code on Forex and Futures
Buy Entry conditions
1. On D1 or H4 Chart - Kijun Sen and (SSA or SS
should move up AND
2. On H1 chart – Kijun Sen and (SSA or SS
should move up AND
3. On M5
a.if there is a squeeze breakout or
b.Stochastic(30,10,10) gold cross happening below 50
Close or Exit conditions
1. On D1 or H4 Chart - when Kijun Sen becomes flat OR
2. On H1 - when Kijun Sen becomes flat OR
3. When close is less than or equal to 1% of the entry price OR
4. On M5
a.If there is a close below the lower Bollinger Band (20,2) OR
b.Stochastic(30,10,10) Dead cross
Bearish View
Sell Entry conditions
1) On D1 or H4 chart – Kijun Sen and ( SSA or SS
should move Down AND
2) On H1 chart – Kijun Sen and (SSA or SS
should move Down AND
3) On M5
a)if there is a squeeze breakdown or
b)Stochastic(30,10,10) Dead cross happening above 50
Close or Exit conditions
1) On D1 or H4 Chart - when Kijun Sen becomes flat OR
2) On H1 - when Kijun Sen becomes flat OR
3) When close is more than or equal to 1% of the entry price OR
4) On M5
a) If there is a close above the upper Bollinger Band (20,2) OR
b) Stochastic(30,10,10) Gold cross
Note1: Squeeze means when Bollinger Bands(20,2) falls into the Keltner Channels (20,1.5,10)
Note2:H1 = one hour chart, Day1=Daily chart, M5 = 5 Minute chart
Note3: I will be looking on 5 minute chart to take entries.
Note4: All entries (Bullish/ Bearish) need to be different color code.
Note5: P/L need to be shown at the bottom of the chart M5.
Note6: I will be back testing this code on Forex and Futures
|
Re: Fun with ThinkScript August 15, 2020 12:27AM |
Registered: 4 years ago Posts: 1 |
Hoping this is something simple to do, if someone can do it for me or point me in the right direction. As is, the study only plots the current days data. I would like the option to see historical data. Thanks in advance!
# Shadow Trader Pivots
# Mobius
# V01.9.2011
#hinthadow Trader Pivots: Take all values from previous intraday market with close taken from the final close value. Settelment Value my differ slightly. POC with dashed line is the previous days point of control and the one Shadow Trader refers to. Volume profile is visible for the past 5 trading days. Pivots are plotted during Market Hours.

# PIVOT = (High + Close + Low)/3 (Values taken from intradays Market)
# R4 = High + 3 x (Pivot - Low)
# R3 = High + 2(Pivot – Low)
# R2 = Pivot + (R1 – S1)
# R1 = (2*Pivot) – Low
# S1 = (2*Pivot) – High
# S2 = Pivot – (R1 – S1)
# S3 = Low – 2(Hi – Pivot)
# S4 = Low - 3 x (High - Pivot)

declare hide_on_daily;

input MktOpen  = 0930; #hint MktOpen: Cash Marekt open EST.
input MktClose = 1600; #hint MktClose: Cash Market close EST.

def h = high;
def l = low;
def c = close;
def Active = if SecondsFromTime(MktOpen) >= 0 and
                SecondsTillTime(MktClose) >= 0
             then 1
             else 0;
def Today = GetDay() == GetLastDay();
def Yesterday = GetDay() == GetLastDay()-1;
def ap = AggregationPeriod.Day;
def last = if Yesterday and !last[1]
           then close(period = ap)[1]
           else if Yesterday and
              SecondsTillTime(MktClose) == 0 and
              SecondsFromTime(MktClose) == 0
              then if c <> last[1]
                   then c
                   else last[1]
              else last[1];
def prevHigh = if Yesterday and !prevHigh[1]
               then high(period = ap)[1]
               else if Yesterday and Active and !Active[1]
               then h
               else if Yesterday and Active and h > prevHigh[1]
                    then h
               else prevHigh[1];
#addLabel(1, "prevHigh " + prevHigh);
def prevLow = if Yesterday and !prevLow[1]
              then low(period = ap)[1]
              else if Yesterday and Active and !Active[1]
               then l
               else if Yesterday and Active and l < prevLow[1]
                    then l
               else prevLow[1];
def BubbleLocation = if Today and Active and !Active[1]
                     then c
                     else double.nan;
plot LastClose = if Today and Active then last else Double.NaN;
LastClose.SetStyle(curve.short_dash);
LastClose.SetDefaultColor(Color.WHITE);
#AddLabel(1, "Yest Close " + LastClose);
AddChartBubble(BubbleLocation, LastClose, "C", Color.Dark_Gray, no);
plot pivot = Round(((LastClose + prevHigh + prevLow) / 3) / TickSize(), 0) * TickSize();
AddChartBubble(BubbleLocation, (pivot), "Pivot", Color.Dark_Gray, yes);
plot R1 = Round(((2 * pivot) - prevLow) / TickSize(), 0) * TickSize();
AddChartBubble(BubbleLocation, HighestAll(R1), "R1", Color.Dark_Gray, no);
plot S1 = Round(((2 * pivot) - prevHigh) / TickSize(), 0) * TickSize();
AddChartBubble(BubbleLocation, HighestAll(S1), "S1", Color.Dark_Gray, yes);
plot R2 = Round((pivot + (R1 - S1)) / TickSize(), 0) * TickSize();
AddChartBubble(BubbleLocation, HighestAll(R2), "R2", Color.Dark_Gray, no);
plot S2 = Round((pivot - (R1 - S1)) / TickSize(), 0) * TickSize();
AddChartBubble(BubbleLocation, HighestAll(S2), "S2", Color.Dark_Gray, yes);
plot R3 = Round((prevHigh + (2 * (pivot - prevLow))) / TickSize(), 0) * TickSize();
AddChartBubble(BubbleLocation, HighestAll(R3), "R3", Color.Dark_Gray, no);
plot S3 = Round((prevLow - (2 * (prevHigh - pivot))) / TickSize(), 0) * TickSize();
AddChartBubble(BubbleLocation, HighestAll(S3), "S3", Color.Dark_Gray, yes);
plot R4 = Round((prevHigh + (3 * (pivot - prevLow))) / TickSize(), 0) * TickSize();
AddChartBubble(BubbleLocation, HighestAll(R4), "R4", Color.Dark_Gray, no);
plot S4 = Round((prevLow - (3 * (prevHigh - pivot))) / TickSize(), 0) * TickSize();
AddChartBubble(BubbleLocation, HighestAll(S4), "S4", Color.Dark_Gray, yes);
pivot.SetPaintingStrategy(PaintingStrategy.DASHES);
pivot.SetDefaultColor(Color.Dark_Orange);
pivot.SetLineWeight(1);
R1.SetPaintingStrategy(PaintingStrategy.DASHES);
R1.SetDefaultColor(Color.GREEN);
R1.SetLineWeight(1);
R2.SetPaintingStrategy(PaintingStrategy.DASHES);
R2.SetDefaultColor(Color.GREEN);
R2.SetLineWeight(1);
R3.SetPaintingStrategy(PaintingStrategy.DASHES);
R3.SetDefaultColor(Color.GREEN);
R3.SetLineWeight(1);
R4.SetPaintingStrategy(PaintingStrategy.DASHES);
R4.SetDefaultColor(Color.GREEN);
R4.SetLineWeight(1);
S1.SetPaintingStrategy(PaintingStrategy.DASHES);
S1.SetDefaultColor(Color.RED);
S1.SetLineWeight(1);
S2.SetPaintingStrategy(PaintingStrategy.DASHES);
S2.SetDefaultColor(Color.RED);
S2.SetLineWeight(1);
S3.SetPaintingStrategy(PaintingStrategy.DASHES);
S3.SetDefaultColor(Color.RED);
S3.SetLineWeight(1);
S4.SetPaintingStrategy(PaintingStrategy.DASHES);
S4.SetDefaultColor(Color.RED);
S4.SetLineWeight(1);
def AvgVolume = Average(volume(period = AggregationPeriod.Day), 21);
addLabel(1, volume(period = AggregationPeriod.Day),
         if volume(period = AggregationPeriod.Day) > AvgVolume
         then color.green
         else color.white);
# End Code Shadow Trader Pivots
## VolumeProfile_RTH and Overnight
# Previous POC Extended to Current Day

def bar = BarNumber();
def RTHBar1 = if SecondsFromTime(MktOpen) == 0 and
                 SecondsTillTime(MktOpen) == 0
              then bar
              else RTHBar1[1];
def RTHBarEnd = if SecondsFromTime(MktClose) == 0 and
                   SecondsTillTime(MktClose) == 0
                then 1
                else Double.NaN;
def cond = bar == RTHBar1; #Active != Active[1];
profile vol = VolumeProfile("startNewProfile" = cond, "onExpansion" = no, "numberOfProfiles" = 10, "pricePerRow" = PricePerRow.TICKSIZE, "value area percent" = 68.4);
def pc = if IsNaN(vol.GetPointOfControl())
         then pc[1]
         else vol.GetPointOfControl();
def hVA = if IsNaN(vol.GetHighestValueArea())
          then hVA[1]
          else vol.GetHighestValueArea();
def lVA = if IsNaN(vol.GetLowestValueArea())
          then lVA[1]
          else vol.GetLowestValueArea();
def hProfile = if IsNaN(vol.GetHighest())# and con
               then hProfile[1]
               else vol.GetHighest();
def lProfile = if IsNaN(vol.GetLowest())# and con
               then lProfile[1]
               else vol.GetLowest();
def POC = if Active then pc else Double.NaN;
def VAHigh = if Active then hVA else Double.NaN;
def VALow = if Active then lVA else Double.NaN;
def PrevPC = if !IsNaN(RTHBarEnd)
            then POC[1]
            else PrevPC[1];
def PrevPCBar = if !IsNaN(RTHBarEnd)
               then bar
               else PrevPCBar[1];
def PrevPC_Limit = if bar == PrevPCBar
                  then Double.NaN
                  else if bar > PrevPCBar
                       then bar - PrevPCBar
                       else PrevPC_Limit[1];
def PrevVAH = if !IsNaN(RTHBarEnd)
            then VAHigh[1]
            else PrevVAH[1];
def PrevVAHBar = if !IsNaN(RTHBarEnd)
               then bar
               else PrevVAHBar[1];
def PrevVAH_Limit = if bar == PrevVAHBar
                  then Double.NaN
                  else if bar > PrevVAHBar
                       then bar - PrevVAHBar
                       else PrevVAH_Limit[1];
def PrevVAL = if !IsNaN(RTHBarEnd)
            then VALow[1]
            else PrevVAL[1];
def PrevVALBar = if !IsNaN(RTHBarEnd)
               then bar
               else PrevVALBar[1];
def PrevVAL_Limit = if bar == PrevVALBar
                  then Double.NaN
                  else if bar > PrevVALBar
                       then bar - PrevVALBar
                       else PrevVAL_Limit[1];
script LinePlot {
    input LineLimit = 0;
    input OnExpansion = yes;
    input data = close;
    input bar = 0;
    def ThisBar = HighestAll(bar);
    def cLine = if bar == ThisBar
                then data
                else Double.NaN;
    def cond1 = CompoundValue(1, if IsNaN(data)
                                 then cond1[1]
                                 else data, data);
    plot P = if ThisBar - LineLimit <= bar
             then HighestAll(cLine)
             else Double.NaN;
    plot ExpLine = if OnExpansion and
                     IsNaN(data[-1])
                   then cond1
                   else Double.NaN;
}
plot PrevPOC = LinePlot(data = PrevPC, LineLimit = PrevPC_Limit, OnExpansion = no, bar = PrevPCBar).P;
PrevPOC.SetDefaultColor(Color.RED);
PrevPOC.SetDefaultColor(Color.RED);
plot PrevVAHline = LinePlot(data = PrevVAH, LineLimit = PrevVAH_Limit, OnExpansion = no, bar = PrevVAHBar).P;
PrevVAHline.SetDefaultColor(Color.RED);
PrevVAHline.SetDefaultColor(Color.RED);
plot PrevVALline = LinePlot(data = PrevVAL, LineLimit = PrevVAL_Limit, OnExpansion = no, bar = PrevVALBar).P;
PrevVALline.SetDefaultColor(Color.RED);
PrevVALline.SetDefaultColor(Color.RED);
addCloud(PrevVALline, PrevVAHline, color.dark_Gray, Color.dark_Gray);
input bubbles = yes;
def n = 2;
def n1 = n + 1;
AddChartBubble(bubbles and !IsNaN(close[n1]) and IsNaN(close[n]), PrevVAH[n1], "VAH", color = Color.YELLOW, yes);
AddChartBubble(bubbles and !IsNaN(close[n1]) and IsNaN(close[n]), PrevVAL[n1], "VAL", Color.YELLOW, no);
AddChartBubble(bubbles and !IsNaN(close[n1]) and IsNaN(close[n]), PrevPOC[n1], "POC", Color.RED, no);
# End POC and Value Area
|
Re: Fun with ThinkScript September 21, 2020 12:04PM |
Registered: 3 years ago Posts: 1 |
I read every page/post of this forum. Thanks to everyone for your contributions!! 
My issue....
I have coded my own combination of indicators....so I am not a newbie BUT I am struggling with something.
I know how to code a signal to happen during a bar (e.g. If X > Y[1] then Z else 0; or If Y[1] < X then Z else 0; ) OR code after the close of a bar (e.g. IF X[1] > Y[2] then Z else 0; etc) BUT....
Does anybody have code/logic to trigger only in the last 2, 3, 5 or 10 mins of any bar? I have the code to avoid a specific time (e.g. do not signal until 9:42am, etc) .....but I am trying to avoid a signal until near the end of every bar on any timeframe......
- Last 3 mins of any 15 minute bar
- Last 5 mins of any 1 hour bar
- Last 10 mins of any Daily bar
etc.
Basically trying to wait until the bar is almost finished but preemptively signal before the close of the bar.....thus avoid most of the noise of signals during the bar and jump ahead of the action that will come at the close of the bar.
Thoughts? Your help is appreciated.
Edited 2 time(s). Last edit at 09/21/2020 12:19PM by BigT4X.
|
Thinkscript finding pit low HELP September 30, 2020 04:52PM |
Registered: 3 years ago Posts: 1 |
Hi,
I'm new to Thinkscript, I'm trying to find recent pit low and the next consecutive bars must great than
e.g. looking previous days to find recent pit low.
7th day Low (L7) >6th day the low (L6) > 5th day low (L5).
3rd day low (L3) > 4th day low (L4) > 5th day low (L5).
from above logic L5 is pit low bar.
1. plot a horizontal line of pit low
2. plot an arrow on bar lwhere the low is greater than L3; if L2<L3 dont plot it, but if L1 >L3 then plot it.
|
Re: Fun with ThinkScript October 12, 2020 03:10PM |
Registered: 8 years ago Posts: 59 |
Does anyone know how to write a script that will give the volume between 12 and 1 o'clock on a particular stock?
# Time #
def TimeF = (SecondsFromTime(“fromTime" = 1200) >= 0);
def TimeH = (SecondsFromTime(“fromTime" = 1300) >= 0);
# Volume #
def Vol = volume("period" = AggregationPeriod.DAY);
Plot VolumeX = vol(TimeH - TimeF);
Thanks, Ralph.
Edited 2 time(s). Last edit at 10/12/2020 03:15PM by Ralph53.
# Time #
def TimeF = (SecondsFromTime(“fromTime" = 1200) >= 0);
def TimeH = (SecondsFromTime(“fromTime" = 1300) >= 0);
# Volume #
def Vol = volume("period" = AggregationPeriod.DAY);
Plot VolumeX = vol(TimeH - TimeF);
Thanks, Ralph.
Edited 2 time(s). Last edit at 10/12/2020 03:15PM by Ralph53.
|
ThinkScript help with SchaffTrendCycle October 19, 2020 08:08AM |
Registered: 3 years ago Posts: 5 |
Hi There forum,
I need help with doing the following with the SchaffTrendCycle:
- #1: plot an arrow above/below the candle that is triggered when STC crosses below/above the overbought/oversold line
- #2: add buy/sell alert messages when #1 is met.
Code:
input fastLength = 23;
input slowLength = 50;
input KPeriod = 10;
input DPeriod = 3;
input over_bought = 75;
input over_sold = 25;
input neutral_zone = 50;
input averageType = AverageType.EXPONENTIAL;
def macd = MovingAverage(averageType, close, fastLength) - MovingAverage(averageType, close, slowLength);
def fastK1 = FastKCustom(macd, KPeriod);
def fastD1 = MovingAverage(averageType, fastK1, DPeriod);
def fastK2 = FastKCustom(fastD1, KPeriod);
plot STC = MovingAverage(averageType, fastK2, DPeriod);
plot OverBought = over_bought;
plot OverSold = over_sold;
plot Neutral = neutral_zone;
STC.SetDefaultColor(GetColor(8));
OverBought.SetDefaultColor(GetColor(7));
OverSold.SetDefaultColor(GetColor(7));
Neutral.SetDefaultColor(GetColor(7));
|
Re: Fun with ThinkScript November 11, 2020 08:01AM |
Registered: 3 years ago Posts: 1 |
Hello All,
Can someone please modify the below, I am trying to see all the following for open trade on an OPTIONS PRICE CHART so that I do not have to flip between the ACCOUNT STATEMENT/ACTIVITY and POSITIONS Tabs.
1.) TRADE QUANTITY
2.) ENTRY AVERAGE COST
3.) MARK PRICE
4.) LAST PRICE
5.) TOTAL TRADE COST
6.) PL
7.) PL%
I tried to manipulate the below code but I was VERY unsuccessful, not experienced enough any help would be great appreciated, thank you in advance.
Dorian
-------------------------------------------------------------------------------------------------------------------------------------------------------------------------
Input ShowPosition = yes;
Input ShowPositionDetails = yes;
def Totqty = GetQuantity();
def openCost = Totqty * GetAveragePrice();
def netLiq = Totqty * close;
def netliqpercent = (NetLiq-NetLiq[1])/NetLiq[1];
Def Display = If (GetAggregationPeriod()==AggregationPeriod.Week or GetAggregationPeriod() ==AggregationPeriod.Month or GetAggregationPeriod() ==AggregationPeriod.OpT_EXP) or !ShowPositionDetails then no else yes;
plot PurchasePrice = if GetAveragePrice() == 0 then Double.NaN else GetAveragePrice();
PurchasePrice.AssignValueColor(If Totqty >0 then Color.DARK_ORANGE else Color.Blue);
PurchasePrice.SetLineWeight(3);
PurchasePrice.SetPaintingStrategy(PaintingStrategy.Line);
#PurchasePrice.SetHiding(!Display);
#plot ManualOpenPL = netLiq – openCost;
def AutoOpenPL = GetOpenPL();
#AddLabel(Totqty and Display, “Qty: ” + Totqty + ” AvgPrice: <b>” + Round(PurchasePrice,2) + “</b> NetLiq: ” + AsDollars(Round(NetLiq,2)) + ” TotCost: “+ Round(openCost,2) +” TodayPL: ” + AsDollars(AutoOpenPL – AutoOpenPL[1])+ ” OpenPL: <b>” + AsDollars(Round(AutoOpenPL,2)) + </b>”,Color.Dark_Gray);
AddLabel(Totqty<0 and ShowPosition, “SHORT QTY: ” + Totqty + ” @” + AsDollars(Round(PurchasePrice, 2))+” NetLiq: ” + AsDollars(Round(NetLiq,2)),Color.Blue);
AddLabel(Totqty>0 and ShowPosition, “LONG QTY: ” + Totqty + ” @” + AsDollars(Round(PurchasePrice, 2))+” NetLiq: ” + AsDollars(Round(NetLiq,2)) ,Color.Dark_Orange);
AddLabel(Totqty and Display, ” AvgPrice: ” + AsDollars(Round(PurchasePrice, 2)) , IF AutoopenPL >=0 then Color.Dark_Green else color.Red);
AddLabel(Totqty and Display, “ThisBarPL: ” + AsDollars(AutoOpenPL – AutoOpenPL[1]) + ” OpenPL: ” + AsDollars(Round(AutoOpenPL, 2)) + ” (” + Round(((NetLiq-OpenCost)/OpenCost)*100,2)+ “%)” , IF AutoopenPL >=0 then Color.Dark_Green else color.Red);
AddLabel(ISNAN(Totqty) and Display, ” No positions currently held.”, Color.Dark_Gray);
|
Help with alert message November 12, 2020 03:38PM |
Registered: 3 years ago Posts: 5 |
Hello Forum
Below is a script that I am having an issue with the alert at the end. It seems proper however, when the condition is met the alert message does not occur for some reason. What am I missing here?
Code:
declare upper;
input price = CLOSE;
input HMA_Length = 55;
input lookback = 2;
input labels=no;
plot HMA = HullMovingAvg(price = price, length = HMA_Length);
def delta = HMA[1] - HMA[lookback + 1];
def delta_per_bar = delta / lookback;
def next_bar = HMA[1] + delta_per_bar;
def concavity = if HMA > next_bar then 1 else -1;
plot turning_point = if concavity[1] != concavity then HMA else double.nan;
HMA.AssignValueColor(Color = if concavity[1] == -1 then
if HMA > HMA[1] then color.yellow else color.blue else
if HMA < HMA[1] then color.yellow else color.orange);
HMA.SetLineWeight(4);
turning_point.SetLineWeight(4);
turning_point.SetPaintingStrategy(paintingStrategy = PaintingStrategy.POINTS);
turning_point.SetDefaultColor(color.white);
plot MA_Max = if HMA[-1] < HMA and HMA > HMA[1] then HMA else Double.NaN;
MA_Max.SetDefaultColor(Color.WHITE);
MA_Max.SetPaintingStrategy(PaintingStrategy.SQUARES);
MA_Max.SetLineWeight(3);
plot MA_Min = if HMA[-1] > HMA and HMA < HMA[1] then HMA else Double.Nan;
MA_Min.SetDefaultColor(Color.WHITE);
MA_Min.SetPaintingStrategy(PaintingStrategy.TRIANGLES);
MA_Min.SetLineWeight(3);
plot sell = if turning_point and concavity == -1 then high else double.nan;
sell.SetDefaultColor(Color.blue);
sell.SetPaintingStrategy(PaintingStrategy.ARROW_DOWN);
sell.SetLineWeight(1);
plot buy = if turning_point and concavity == 1 then low else double.nan;
buy.SetDefaultColor(Color.orange);
buy.SetPaintingStrategy(PaintingStrategy.ARROW_UP);
buy.SetLineWeight(1);
def ROC = HMA - next_bar;
addLabel(yes and labels, concat("ROC: " , ROC), color = if concavity < 0 then if ROC[1] > ROC then Color.blue else color.black else if ROC[1] < ROC then color.orange else color.red);
def arrow_plots = high-low;
def plothigh = high + arrow_plots * 0.5;
def plotlow = low - arrow_plots * 0.5;
plot arrowUP = if MA_Min then plotlow else double.nan;
ArrowUP.setpaintingStrategy(PaintingStrategy.ARROW_UP);
ArrowUP.SetLineWeight(3);
ArrowUP.SetDefaultColor(Color.ORANGE);
plot arrowdown = if MA_Max then plothigh else double.nan;
ArrowDown.setpaintingStrategy(PaintingStrategy.ARROW_Down);
ArrowDown.SetLineWeight(3);
ArrowDown.SetDefaultColor(Color.BLUE);
def condition1 = MA_Min;
def condition2 = MA_Max;
Alert(condition1, "MA Min buy", Alert.Bar, Sound.Chimes);
Alert(condition2, "MA Max sell", Alert.Bar, Sound.Bell);


Sorry, only registered users may post in this forum.
Trade with Knowledge, Trade with Power - ResearchTrade.com.