Fun with ThinkScript
Posted by robert
|
Re: Fun with ThinkScript January 30, 2016 02:19AM |
Registered: 8 years ago Posts: 161 |
|
Re: Fun with ThinkScript January 30, 2016 03:49PM |
Registered: 8 years ago Posts: 25 |
|
Re: Fun with ThinkScript January 30, 2016 03:51PM |
Registered: 8 years ago Posts: 25 |
tanman Wrote:
-------------------------------------------------------
> Kamadi,
>
> This will plot a horizontal blue dashed line at
> daily opening price on any time frame. You can
> change the color or change to solid line inside
> the code itself. For solid line change "DASHES" to
> "HORIZONTAL".
>
> def today = GetLastDay() == GetDay();
> plot OpenPrice = if !today then Double.NaN else if
> SecondsTillTime(0930) > 0 then Double.NaN else
> open(period = "day" );
> OpenPrice.SetPaintingStrategy(PaintingStrategy.DAS
> HES);
> OpenPrice.SetDefaultColor(Color.BLUE);
> OpenPrice.SetLineWeight(2);
Tanman,
Can you write a study to add a horizontal line 16 ticks above and below the horizontal open price line?
Thanks
Jack L
|
Re: Directional Divergence Index ( DDI ) need a THINKORSWIM Script January 31, 2016 03:15AM |
Registered: 8 years ago Posts: 7 |
Hello Baffled1 & Tanman
I have found this website which describe the Directional Divergence Index ( DDI )
[finance.easychart.net]
so could you please help me with the formula in TOS or in tradestation
Hani
I have found this website which describe the Directional Divergence Index ( DDI )
[finance.easychart.net]
so could you please help me with the formula in TOS or in tradestation
Hani
|
Re: Directional Divergence Index ( DDI ) need a THINKORSWIM Script January 31, 2016 12:39PM |
Registered: 10 years ago Posts: 63 |
OK, playing with this DDI & need help from Baffled1 & Tanman
REF(f,N)
SMA(f,N,M) DMA(f,M/N), M<N
I have not worked on the histogram
is this close?
declare lower;
input N = 13;
input N1 = 30;
input M = 10;
input M1 = 5;
def TR = absvalue(high-high[1]);
def TR2 = absvalue(low-low[1]);
#DMZ : = IF ( ( H+L ) < = ( REF ( H,1 ) + REF ( L,1 ) ) , 0 , MAX ( ABS ( H - REF #( H , 1 ) ) ,
#ABS ( L - REF ( L , 1 ) ) ) ) ;
def DMZ = if (high+low) <= (high[1]+low[1]) then 0 else absvalue(high-high[1]) and absvalue(low-low[1]);
#DMF : = IF ( ( H+L ) > = ( REF ( H ,1 ) + REF ( L,1 ) ) , 0, MAX ( ABS ( H - REF #( H , 1 ) ) ,
#ABS ( L - REF ( L, 1 ) ) ) ) ;
def DMF = if (high+low) >= (high[1]+low[1]) then 0 else absvalue(high-high[1]) and absvalue(low-low[1]);
#DIZ : = SUM ( DMZ , N ) / ( SUM ( DMZ , N ) + SUM ( DMF , N ) ) ;
def DIZ = sum(DMZ,N)/(sum(DMZ,N) + sum(DMF,N));
#DIF : = SUM ( DMF , N ) / ( SUM ( DMF , N ) + SUM ( DMZ , N ) ) ;
def DIF = sum(DMF,N)/(sum(DMF,N) + sum(DMZ,N));
#DDI : DIZ - DIF , COLORSTICK ;
def DDI = DIZ-DIF;
#ADDI : SMA ( DDI , N1 , M ) ;
plot ADDI = average(DDI,(N1/M));
#AD : MA ( ADDI , M1 ) ;
plot AD = average(ADDI,M1);
#TR : = MAX ( ABS (H - REF ( H , 1 ) ) , ABS ( L - REF ( L , 1 ) ) ) ;
#addcloud(ADDI,AD,color.plum,color.magenta);DMA(f,M/N)
|
Re: Directional Divergence Index ( DDI ) need a THINKORSWIM Script February 01, 2016 12:12AM |
Registered: 8 years ago Posts: 161 |
Game0ver, your code runs okay- and even looks useful. But what's still got me puzzled is "TR1" and "TR2".?? BTW, I don't think we can create histogram bars for a custom study anyway. I don't know what else I can contribute on this. Maybe Tanman or someone else?
Oh, Bughatti, I looked at the link and couldn't figure it out from there. I was thinking a verbal description for help.
Gamblers roll the dice; Traders load the dice.
Edited 1 time(s). Last edit at 02/01/2016 12:14AM by baffled1.
Oh, Bughatti, I looked at the link and couldn't figure it out from there. I was thinking a verbal description for help.
Gamblers roll the dice; Traders load the dice.
Edited 1 time(s). Last edit at 02/01/2016 12:14AM by baffled1.
|
Re: Directional Divergence Index ( DDI ) need a THINKORSWIM Script February 01, 2016 10:15AM |
Registered: 10 years ago Posts: 63 |
|
Re: Fun with ThinkScript February 01, 2016 12:59PM |
Registered: 10 years ago Posts: 143 |
Game0ver, hanimusa, baffled1,
There are some mistakes in Game0ver's script but good effort
Here is the script for DDI with histogram as per code provided by hanimusa:
declare lower;
input N = 13;
input N1 = 30;
input M = 10;
input M1 = 5;
def TR = max(AbsValue(high - high[1]), AbsValue(low - low[1]));
def DMZ = if((high + low) <= (high[1] + low[1]), 0, max(AbsValue(high - high[1]), AbsValue(low - low[1])));
def DMF = if((high + low) >= (high[1] + low[1]), 0, max(AbsValue(high - high[1]), AbsValue(low - low[1])));
def DIZ = sum(DMZ, N)/(sum(DMZ, N) + sum(DMF, N));
def DIF = sum(DMF, N)/(sum(DMF, N) + sum(DMZ, N));
plot DDI = DIZ - DIF;
DDI.AssignValueColor(Color.GRAY);
plot ADDI = Average(DDI[-M], N1);
ADDI.AssignValueColor(Color.UPTICK);
plot AD = Average(ADDI, M1);
AD.AssignValueColor(Color.DOWNTICK);
plot Diff = (DDI - (ADDI + AD)/2);
plot ZeroLine = 0;
Diff.SetPaintingStrategy(PaintingStrategy.HISTOGRAM);
Diff.SetDefaultColor(Color.RED);
Diff.SetLineWeight(3);
Diff.AssignValueColor(if Diff >= 0 then Color.UPTICK else Color.DOWNTICK);
Here is DDI without histogram:
declare lower;
input N = 13;
input N1 = 30;
input M = 10;
input M1 = 5;
def TR = max(AbsValue(high - high[1]), AbsValue(low - low[1]));
def DMZ = if((high + low) <= (high[1] + low[1]), 0, max(AbsValue(high - high[1]), AbsValue(low - low[1])));
def DMF = if((high + low) >= (high[1] + low[1]), 0, max(AbsValue(high - high[1]), AbsValue(low - low[1])));
def DIZ = sum(DMZ, N)/(sum(DMZ, N) + sum(DMF, N));
def DIF = sum(DMF, N)/(sum(DMF, N) + sum(DMZ, N));
plot DDI = DIZ - DIF;
DDI.AssignValueColor(Color.GRAY);
plot ADDI = Average(DDI[-M], N1);
ADDI.AssignValueColor(Color.UPTICK);
plot AD = Average(ADDI, M1);
AD.AssignValueColor(Color.DOWNTICK);
Here is only DDI histogram:
declare lower;
input N = 13;
input N1 = 30;
input M = 10;
input M1 = 5;
def TR = max(AbsValue(high - high[1]), AbsValue(low - low[1]));
def DMZ = if((high + low) <= (high[1] + low[1]), 0, max(AbsValue(high - high[1]), AbsValue(low - low[1])));
def DMF = if((high + low) >= (high[1] + low[1]), 0, max(AbsValue(high - high[1]), AbsValue(low - low[1])));
def DIZ = sum(DMZ, N)/(sum(DMZ, N) + sum(DMF, N));
def DIF = sum(DMF, N)/(sum(DMF, N) + sum(DMZ, N));
def DDI = DIZ - DIF;
def ADDI = Average(DDI[-M], N1);
def AD = Average(ADDI, M1);
plot Diff = (DDI - (ADDI + AD)/2);
plot ZeroLine = 0;
Diff.SetPaintingStrategy(PaintingStrategy.HISTOGRAM);
Diff.SetDefaultColor(Color.RED);
Diff.SetLineWeight(3);
Diff.AssignValueColor(if Diff >= 0 then Color.UPTICK else Color.DOWNTICK);
Edited 1 time(s). Last edit at 02/01/2016 01:02PM by tanman.
|
Re: Fun with ThinkScript February 01, 2016 01:19PM |
Registered: 10 years ago Posts: 143 |
JML,
This will be correct only for E-mini S&P futures, and I assumed that's what you wanted:
def today = GetLastDay() == GetDay();
def DayOpen = open(period = "day" );
plot OpenPrice = if !today then Double.NaN else if SecondsTillTime(0930) > 0 then Double.NaN else DayOpen;
OpenPrice.SetStyle(Curve.MEDIUM_DASH);
OpenPrice.SetDefaultColor(Color.BLUE);
OpenPrice.SetLineWeight(2);
plot UB = if !today then Double.NaN else if SecondsTillTime(0930) > 0 then Double.NaN else DayOpen + 4;
UB.SetStyle(Curve.FIRM);
UB.SetDefaultColor(Color.DOWNTICK);
plot LB = if !today then Double.NaN else if SecondsTillTime(0930) > 0 then Double.NaN else DayOpen - 4;
LB.SetStyle(Curve.FIRM);
LB.SetDefaultColor(Color.UPTICK);
Edited 1 time(s). Last edit at 02/01/2016 01:27PM by tanman.
|
Re: Fun with ThinkScript February 01, 2016 01:55PM |
Registered: 10 years ago Posts: 63 |
tanman, thanks
I went to
[finance.easychart.net]
plugged in QQQ
it prints a different graph than in TOS
[imgur.com]
I went to
[finance.easychart.net]
plugged in QQQ
it prints a different graph than in TOS
[imgur.com]
|
Re: Directional Divergence Index ( DDI ) need a THINKORSWIM Script February 01, 2016 02:51PM |
Registered: 8 years ago Posts: 7 |
|
Re: Directional Divergence Index ( DDI ) need a THINKORSWIM Script February 01, 2016 03:17PM |
Registered: 10 years ago Posts: 63 |
|
Re: Fun with ThinkScript February 01, 2016 05:22PM |
Registered: 10 years ago Posts: 143 |
It should be
def UP = ADDI > AD
in the first line for it to change color when ADDI and AD cross otherwise use the same as Game0ver said. I think crossover makes more sense.
Game0ver, thanks for the picture. I will edit the code accordingly.
Edited 2 time(s). Last edit at 02/01/2016 05:31PM by tanman.
def UP = ADDI > AD
in the first line for it to change color when ADDI and AD cross otherwise use the same as Game0ver said. I think crossover makes more sense.
Game0ver, thanks for the picture. I will edit the code accordingly.
Edited 2 time(s). Last edit at 02/01/2016 05:31PM by tanman.
|
Re: Directional Divergence Index ( DDI ) need a THINKORSWIM Script February 01, 2016 05:49PM |
Registered: 8 years ago Posts: 7 |
Game0ver Wrote:
-------------------------------------------------------
> tanman, thanks
> I went to
> [finance.easychart.net]
> ?Id=2&File=Basic.fml
> plugged in QQQ
> it prints a different graph than in TOS
> [imgur.com]
Thanks Tanman, Game0ver, Baffled1, and all cooperatives ,
but really there is real different which will affect the results if analyzing the chart
please compare the two charts between the
plugged in QQQ as example in
[finance.easychart.net]
and
[imgur.com]
it is printing a different chart
what the problem !!
Hani
Edited 1 time(s). Last edit at 02/01/2016 05:53PM by hanimusa.
|
Re: Fun with ThinkScript February 01, 2016 06:13PM |
Registered: 8 years ago Posts: 161 |
Tanman, once again, you are da man! Racked my brain for custom histogram- assumed it could only be done for canned studies. A big Thank You!Quote
TANMAN
> Game0ver, hanimusa, baffled1...
...Here is the script for DDI with histogram as per
> code provided by hanimusa:
Gamblers roll the dice; Traders load the dice.
|
Re: Directional Divergence Index ( DDI ) need a THINKORSWIM Script February 01, 2016 06:28PM |
Registered: 8 years ago Posts: 161 |
Hani, I think the difference is that "TR" thing. Until we know what that is, we're stuck. Just my opinion. As shrewd as Tanman and Game0ver's code is, TR still has only a def and no further function whatsoever. It's why I said I just stuck those defs in but was useless code. Could TR mean "total range" or something? And if so, how does it affect the "correct" code?Quote
Hani
> but really there is real different which will
> affect the results if analyzing the chart
... what the problem !!
> Hani
Gamblers roll the dice; Traders load the dice.
|
Re: Fun with ThinkScript February 01, 2016 06:47PM |
Registered: 10 years ago Posts: 143 |
hanimusa, Game0ver, baffled1,
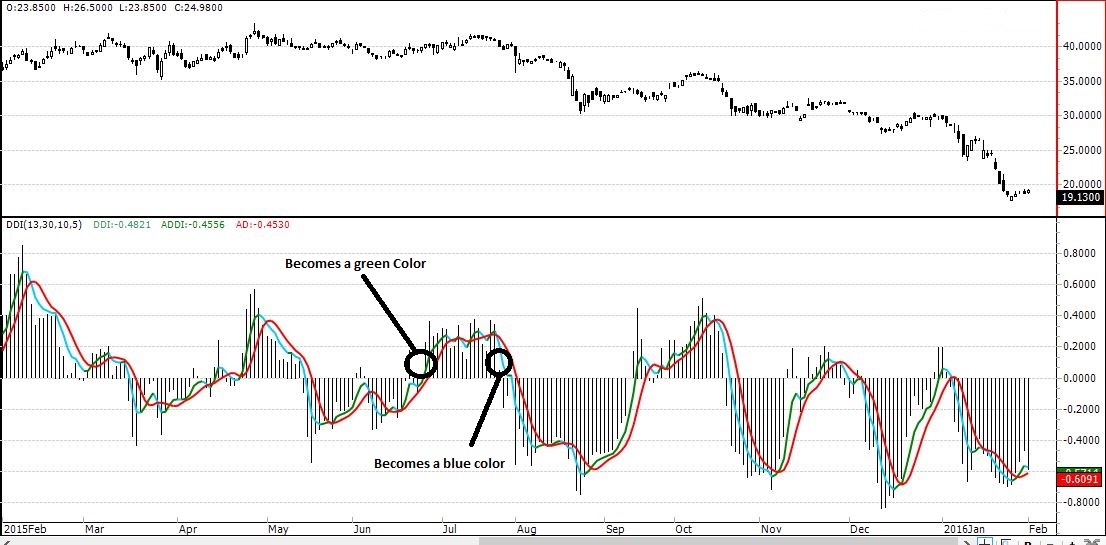
This is the closest I could come to the picture. There is something funky in the original printed script on that website, probably a mistype in the input value of N1. Let me know if this is acceptable because if I use the same exact value for N1 given in the original code it completely changes the drawing from the one in the picture. I used 3 for N1 instead of 30 so probably the extra 0 is a mistype and cost me a lot of time to figure it out because of that. Also the script used by the referenced chart draws a histogram in a completely different way than thinkscript which was the cause of my earlier mistake. The printed script also defines TR but doesn't use it so I fixed that. Printed script definitely has errors.
declare lower;
input N = 13;
input N1 = 3;
input M = 10;
input M1 = 5;
def TR = max(AbsValue(high - high[1]), AbsValue(low - low[1]));
def DMZ = if((high + low) <= (high[1] + low[1]), 0, TR);
def DMF = if((high + low) >= (high[1] + low[1]), 0, TR);
def DIZ = sum(DMZ, N)/(sum(DMZ, N) + sum(DMF, N));
def DIF = sum(DMF, N)/(sum(DMF, N) + sum(DMZ, N));
plot DDI = DIZ - DIF;
plot ZeroLine = 0;
DDI.AssignValueColor(Color.GRAY);
DDI.SetPaintingStrategy(PaintingStrategy.HISTOGRAM);
DDI.SetDefaultColor(Color.RED);
DDI.SetLineWeight(1);
DDI.AssignValueColor(if DDI >= 0 then Color.UPTICK else Color.DOWNTICK);
plot ADDI = MovingAverage(AverageType.SIMPLE, DDI[- N1], M);
plot AD = Average(ADDI, M1);
def UP = ADDI > AD;
AD.AssignValueColor(Color.DOWNTICK);
ADDI.AssignValueColor(if UP then Color.GREEN else Color.CYAN);
Edited 2 time(s). Last edit at 02/01/2016 06:57PM by tanman.
|
Re: Fun with ThinkScript February 01, 2016 07:09PM |
Registered: 8 years ago Posts: 25 |
tanman Wrote:
-------------------------------------------------------
> JML,
>
> This will be correct only for E-mini S&P futures,
> and I assumed that's what you wanted:
>
> def today = GetLastDay() == GetDay();
> def DayOpen = open(period = "day" );
> plot OpenPrice = if !today then Double.NaN else if
> SecondsTillTime(0930) > 0 then Double.NaN else
> DayOpen;
> OpenPrice.SetStyle(Curve.MEDIUM_DASH);
> OpenPrice.SetDefaultColor(Color.BLUE);
> OpenPrice.SetLineWeight(2);
> plot UB = if !today then Double.NaN else if
> SecondsTillTime(0930) > 0 then Double.NaN else
> DayOpen + 4;
> UB.SetStyle(Curve.FIRM);
> UB.SetDefaultColor(Color.DOWNTICK);
> plot LB = if !today then Double.NaN else if
> SecondsTillTime(0930) > 0 then Double.NaN else
> DayOpen - 4;
> LB.SetStyle(Curve.FIRM);
> LB.SetDefaultColor(Color.UPTICK);
Tanman,
I would like the 9:30 EST US open to start plotting at 9:30 EST not the 6PM EST.
Can you make that change? all else looks great!
Thanks
Jack L
|
Re: Fun with ThinkScript February 02, 2016 01:53PM |
Registered: 10 years ago Posts: 143 |
Jack L,
That is waaaay more complicated
Anyway here it is after lot of thinking
input Show_Only_Today = YES;
input Market_Open_Time = 0930;
def Today = GetDay() == GetLastDay();
def ShouldPlot = if(Show_Only_Today and SecondsTillTime(0930) < 0, 1, if(!Show_Only_Today, 1, 0));
def OpeningBell = if SecondsTillTime(Market_Open_Time)[1] >= 0 and SecondsTillTime(Market_Open_Time) < 0 or (SecondsTillTime(Market_Open_Time)[1] < SecondsTillTime(Market_Open_Time) and SecondsTillTime(Market_Open_Time)[1] >= 0) then 1 else 0;
rec RunningOpen = CompoundValue(1, if Openingbell then open[1] else RunningOpen[1], open);
rec PrevOpen = CompoundValue(1, if OpeningBell then RunningOpen else PrevOpen[1], open);
plot PO = if ShouldPlot then PrevOpen else Double.NaN;
PO.SetStyle(Curve.SHORT_DASH);
PO.SetDefaultColor(Color.BLUE);
PO.SetLineWeight(2);
plot UB = if ShouldPlot then PrevOpen + 4 else Double.NaN;
UB.SetStyle(Curve.FIRM);
UB.SetDefaultColor(Color.DOWNTICK);
UB.SetLineWeight(2);
plot LB = if ShouldPlot then PrevOpen - 4 else Double.NaN;
LB.SetStyle(Curve.FIRM);
LB.SetDefaultColor(Color.UPTICK);
LB.SetLineWeight(2);
Edited 1 time(s). Last edit at 02/02/2016 02:06PM by tanman.
|
Re: Fun with ThinkScript February 02, 2016 04:44PM |
Registered: 8 years ago Posts: 25 |
tanman Wrote:
-------------------------------------------------------
> Jack L,
>
> That is waaaay more complicated
>
> Anyway here it is after lot of thinking
>
> input Show_Only_Today = YES;
> input Market_Open_Time = 0930;
>
> def Today = GetDay() == GetLastDay();
> def ShouldPlot = if(Show_Only_Today and
> SecondsTillTime(0930) < 0, 1, if(!Show_Only_Today,
> 1, 0));
> def OpeningBell = if
> SecondsTillTime(Market_Open_Time)[1] >= 0 and
> SecondsTillTime(Market_Open_Time) < 0 or
> (SecondsTillTime(Market_Open_Time)[1] <
> SecondsTillTime(Market_Open_Time) and
> SecondsTillTime(Market_Open_Time)[1] >= 0) then 1
> else 0;
>
> rec RunningOpen = CompoundValue(1, if Openingbell
> then open[1] else RunningOpen[1], open);
> rec PrevOpen = CompoundValue(1, if OpeningBell
> then RunningOpen else PrevOpen[1], open);
>
> plot PO = if ShouldPlot then PrevOpen else
> Double.NaN;
> PO.SetStyle(Curve.SHORT_DASH);
> PO.SetDefaultColor(Color.BLUE);
> PO.SetLineWeight(2);
> plot UB = if ShouldPlot then PrevOpen + 4 else
> Double.NaN;
> UB.SetStyle(Curve.FIRM);
> UB.SetDefaultColor(Color.DOWNTICK);
> UB.SetLineWeight(2);
> plot LB = if ShouldPlot then PrevOpen - 4 else
> Double.NaN;
> LB.SetStyle(Curve.FIRM);
> LB.SetDefaultColor(Color.UPTICK);
> LB.SetLineWeight(2);
Tanman,
Perfect!! You are the best!
Appreciate what you and the others thinkscript gurus do.
Jack L
|
Re: Fun with ThinkScript February 02, 2016 05:28PM |
Registered: 9 years ago Posts: 78 |
can anyone offer a little custom watchlist column help? i use a crossover-type indicator called the trader's dynamic index that i've put in a watchlist column that turns green when "price" is above "signal" and otherwise is red. the values for "price" also show up in the column. only, the values i get don't match the values of the TDI when it is used alone as a study. can anyone tell what i might be doing wrong from the column script i've posted below?
also, if i wanted another column that displayed the indicator for the previous time period, where would i put [1]?
thanks!
# TS_TradersDynamicIndex
input RSI_Period = 13; #8-25
input RSI_Price = 0; #0-6
input Volatility_Band = 34; #20-40
input RSI_Price_Line = 2;
input Trade_Signal_Line = 7;
input STDEV_Multiplier = 1.62;
input averageType = {default SMA, EMA};
def DYNRSI = reference RSI(RSI_Period);
def Price = if averageType == averageType.SMA then Average(DYNRSI, RSI_Price_Line) else ExpAverage(DYNRSI, RSI_Price_Line);
def Signal = if averageType == averageType.SMA then Average(DYNRSI, Trade_Signal_Line) else ExpAverage(DYNRSI, Trade_Signal_Line);
plot above = price ;
Assignbackgroundcolor (if above > signal then Color.dark_Green else Color.dark_Red);
#################
|
Re: Fun with ThinkScript February 03, 2016 12:57AM |
Registered: 10 years ago Posts: 143 |
Linter,
I am doing it just off the top of my head without checking it on TOS. Let me know if it works. Also make sure you are choosing the same average type in both regular study and watch list. Also you are using too many inputs that are not even being used in this script.
# TS_TradersDynamicIndex
input RSI_Period = 13; #8-25
input RSI_Price_Line = 2;
input Trade_Signal_Line = 7;
input averageType = {default averageType.SIMPLE, averageType.EXPONENTIAL};
def DYNRSI = reference RSI(RSI_Period);
def Price = MovingAverage(averageType, DYNRSI, RSI_Price_Line);
def Signal = MovingAverage(averageType, DYNRSI, Trade_Signal_Line);
plot Above = Price;
Assignbackgroundcolor (if Above > Signal then Color.DARK_GREEN else Color.DARK_RED);
For previous period just substitute if Above[1] > Signal[1] in last line.
|
Re: Fun with ThinkScript February 03, 2016 07:41AM |
Registered: 9 years ago Posts: 78 |
tanman: thanks for that. sadly, it produces the same results as what i posted. (reason for all those inputs is, i took the script from a study and didn't know what to keep or throw out for a custom column.) the averageType input you gave didn't work, so i went back to what i had -- input averageType = {default SMA, EMA}; -- but i don't think that makes a diff, does it?
here is the original study, in case you have a moment and can or care to investigate further. thanks!
# TS_TradersDynamicIndex
# [www.thinkscripter.com]
# thinkscripter@gmail.com
# Last Update 14 NOV 11
declare lower;
input RSI_Period = 13; #8-25
input RSI_Price = 0; #0-6
input Volatility_Band = 34; #20-40
input RSI_Price_Line = 2;
input Trade_Signal_Line = 7;
input STDEV_Multiplier = 1.62;
input averageType = {default SMA, EMA};
def DYNRSI = reference RSI(RSI_Period);
def Price = if averageType == averageType.SMA then Average(DYNRSI, RSI_Price_Line) else ExpAverage(DYNRSI, RSI_Price_Line);
def Signal = if averageType == averageType.SMA then Average(DYNRSI, Trade_Signal_Line) else ExpAverage(DYNRSI, Trade_Signal_Line);
plot DYNPrice = Price;
DYNPrice.SetDefaultColor(Color.GREEN);
DYNPrice.SetLineWeight(2);
plot DYNSignal = Signal;
DYNSignal.SetDefaultColor(Color.RED);
DYNSignal.SetLineWeight(2);
plot DYNAverage = Average(DYNRSI, Volatility_Band);
DYNAverage.SetDefaultColor(Color.YELLOW);
DYNAverage.SetLineWeight(2);
def SDBB = StDev(DYNRSI, Volatility_Band);
plot UpperBollinger = DYNAverage + STDEV_Multiplier * SDBB;
UpperBollinger.SetDefaultColor(Color.BLUE);
plot LowerBollinger = DYNAverage - STDEV_Multiplier * SDBB;
LowerBollinger.SetDefaultColor(Color.BLUE);
plot UL = 68;
plot ML = 50;
plot LL = 32;
UL.SetStyle(Curve.SHORT_DASH);
ML.SetStyle(Curve.SHORT_DASH);
LL.SetStyle(Curve.SHORT_DASH);
UL.SetDefaultColor(Color.GRAY);
ML.SetDefaultColor(Color.GRAY);
LL.SetDefaultColor(Color.GRAY);
|
Re: Fun with ThinkScript February 03, 2016 07:53AM |
Registered: 9 years ago Posts: 78 |
btw / here (hopefully) is a screenshot showing the diff in numbers on eur/gbp. column shows 38 and study shows like 28. and yes, i have both aggregation periods set to 1 hr.


p.s. i know it looks like the 38 corresponds to the 38 on the study but that's just a coincidence. i think.
Edited 2 time(s). Last edit at 02/03/2016 07:59AM by linter.
p.s. i know it looks like the 38 corresponds to the 38 on the study but that's just a coincidence. i think.
Edited 2 time(s). Last edit at 02/03/2016 07:59AM by linter.
|
Re: Fun with ThinkScript February 03, 2016 12:51PM |
Registered: 9 years ago Posts: 78 |
|
Re: Fun with ThinkScript February 03, 2016 03:10PM |
Registered: 8 years ago Posts: 161 |
linter, run it as a Scan, then refresh Scan and post to Watchlist?? Just guessing.
Okay, heelllllllpppppp! Problem driving me crazy. I want the biggest value and smallest value in a series of values. Normal applications of Highest, Lowest, TrueRange, ATR, Min, and Max don't work for this (near as I can tell) because they limit the number of variables and I'm running 11 variables. You could say I'm looking for Range.
EXAMPLE:
declare lower;
def A = whatever1;
def B = whatever2;
def C = whatever3;
def D = whatever4;
def E = whatever5;
plot myhighest = highest of A,B,C,D,E;
plot mylowest = lowest of A,B,C,D,E;
Thanks for any help!
Gamblers roll the dice; Traders load the dice.
|
Re: Fun with ThinkScript February 03, 2016 03:14PM |
Registered: 9 years ago Posts: 60 |
tanman Wrote:
-------------------------------------------------------
> hanimusa, Game0ver, baffled1,
>
> This is the closest I could come to the picture.
> There is something funky in the original printed
> script on that website, probably a mistype in the
> input value of N1. Let me know if this is
> acceptable because if I use the same exact value
> for N1 given in the original code it completely
> changes the drawing from the one in the picture. I
> used 3 for N1 instead of 30 so probably the extra
> 0 is a mistype and cost me a lot of time to figure
> it out because of that. Also the script used by
> the referenced chart draws a histogram in a
> completely different way than thinkscript which
> was the cause of my earlier mistake. The printed
> script also defines TR but doesn't use it so I
> fixed that. Printed script definitely has errors.
>
>
> declare lower;
>
> input N = 13;
> input N1 = 3;
> input M = 10;
> input M1 = 5;
>
> def TR = max(AbsValue(high - high[1]),
> AbsValue(low - low[1]));
> def DMZ = if((high + low) <= (high[1] + low[1]),
> 0, TR);
> def DMF = if((high + low) >= (high[1] + low[1]),
> 0, TR);
> def DIZ = sum(DMZ, N)/(sum(DMZ, N) + sum(DMF, N));
>
> def DIF = sum(DMF, N)/(sum(DMF, N) + sum(DMZ, N));
>
>
> plot DDI = DIZ - DIF;
> plot ZeroLine = 0;
> DDI.AssignValueColor(Color.GRAY);
> DDI.SetPaintingStrategy(PaintingStrategy.HISTOGRAM
> );
> DDI.SetDefaultColor(Color.RED);
> DDI.SetLineWeight(1);
> DDI.AssignValueColor(if DDI >= 0 then Color.UPTICK
> else Color.DOWNTICK);
> plot ADDI = MovingAverage(AverageType.SIMPLE,
> DDI[- N1], M);
> plot AD = Average(ADDI, M1);
> def UP = ADDI > AD;
> AD.AssignValueColor(Color.DOWNTICK);
> ADDI.AssignValueColor(if UP then Color.GREEN else
> Color.CYAN);
.
Could you make code to show green and red signals when DDI crossing ?
Edited 1 time(s). Last edit at 02/03/2016 03:26PM by SARA.
|
Re: Fun with ThinkScript February 03, 2016 05:05PM |
Registered: 10 years ago Posts: 143 |
|
Re: Fun with ThinkScript February 03, 2016 05:29PM |
Registered: 10 years ago Posts: 143 |
Sara,
This should be used separately as a different study from the histogram study:
# define DDI Indicator values
input N = 13;
input N1 = 3;
input M = 10;
input M1 = 5;
def TR = max(AbsValue(high - high[1]), AbsValue(low - low[1]));
def DMZ = if((high + low) <= (high[1] + low[1]), 0, TR);
def DMF = if((high + low) >= (high[1] + low[1]), 0, TR);
def DIZ = sum(DMZ, N)/(sum(DMZ, N) + sum(DMF, N));
def DIF = sum(DMF, N)/(sum(DMF, N) + sum(DMZ, N));
def DDI = DIZ - DIF;
def ADDI = MovingAverage(AverageType.SIMPLE, DDI[- N1], M);
def AD = Average(ADDI, M1);
# long and short signal formula
plot SignalBuy = if ADDI[1] < AD[1] and ADDI > AD then low else Double.NaN;
plot SignalSell = if ADDI[1] > AD[1] and ADDI < AD then high else Double.NaN;
# show green up arrow for buy signal and red down arrow for sell signal
SignalBuy.SetPaintingStrategy(PaintingStrategy.ARROW_UP);
SignalBuy.AssignValueColor(Color.UPTICK);
SignalSell.SetpaintingStrategy(PaintingStrategy.ARROW_DOWN);
SignalSell.AssignValueColor(Color.RED);
Edited 1 time(s). Last edit at 02/03/2016 05:49PM by tanman.
|
Re: Fun with ThinkScript February 03, 2016 05:47PM |
Registered: 10 years ago Posts: 143 |


Sorry, only registered users may post in this forum.
Trade with Knowledge, Trade with Power - ResearchTrade.com.