Fun with ThinkScript
Posted by robert
|
Re: Fun with ThinkScript July 03, 2015 04:01PM |
Registered: 8 years ago Posts: 26 |
Tampman,
The stochrsi is already in the study script. The very first black of the code is it. I didn't plot the stochrsi in the study because we just care about c value. I plot it the stoch rsi just for reference but the code was just taken from the study plan. The vertucal line signal is already taking into account if stochrsi crossing. You don't need extra subgraph for stochrsi.
For the strategy you have to put the code in strategy not study.
|
Re: Fun with ThinkScript July 03, 2015 11:11PM |
Registered: 8 years ago Posts: 161 |
Robert, I'm amazed you do all this just to help people. Thank you. Anyway, I'm stumped. Believe it or not, I actually teach basic Thinkscript to folks, enough so they can add and subtract anyway but nothing advanced (because I'm not advanced). So my question is:
How do I get an average for a conditional event? Base code works fine and is:
def runup1 = close>close[1];
def runup2 = close>close[2];
#Most people write the next line as ISTRUE but this works fine for me
plot Above = runup1 and runup2;
Above.SetDefaultColor(Color.blue);
Above.SetPaintingStrategy(PaintingStrategy.BOOLEAN_ARROW_UP);
So that pops me a nice arrow when true. And it's excellent long signal. So I enter long at the next candle. But I want an average (high-close) value for that next candle, i.e., an average for, say, the last 50 instances of that "next" candle, instead of an average for all the non-event intervening candles. Your help much appreciated.
Edited 1 time(s). Last edit at 07/03/2015 11:27PM by baffled1.
|
Re: Fun with ThinkScript July 04, 2015 12:34AM |
Registered: 8 years ago Posts: 59 |
Robert I have 3 more quick questions
1) How should this line appear if I don't want the Bubble hidden? condition.HideBubble();
2) Is there a condition line for selecting 'Leftaxis' on a chart?
3) On this script you wrote for me;
def X = (open("period" = AggregationPeriod.DAY) - .05);
def lastbar = HighestAll(if IsNaN(close) then 0 else BarNumber());
plot condition = if BarNumber() <= lastbar - 10 and BarNumber() >= lastbar - 25 then GetValue(X, BarNumber() - lastbar) else Double.NaN;
Is there a way to place 2 different 'def' lines in the same script at once? I need the line to switch to 'def L' if the candlestick is red and 'def H' if it's green;
def L = Lowest(Low +.01, 6) 'if' close <= Open;
def H = Highest(High -.01, 6) 'if' close >= Open;
Thanks Again. I hope this makes sense.
|
Re: Fun with ThinkScript July 04, 2015 06:44AM |
Registered: 8 years ago Posts: 61 |
Howo3579 - Thanks ... I added the Strategy to the Strategies set and it shows on the chart now... However, the C level shows 100(100000) and -100(-100000)? No 2 or 3 etc... like in your chart? So I screwed something up again..lol.. And if I understand you correctly the StochRSI at bottom of your chart is only there for reference and is not another study that you specially created? (although it says 4hr STochRSI?) I'd show you my chart but can't figure out how to attach it here...
Thanks for the help and Happy 4th!
Thanks for the help and Happy 4th!
|
Re: Fun with ThinkScript July 04, 2015 06:58AM |
Registered: 8 years ago Posts: 26 |
|
Re: Fun with ThinkScript July 04, 2015 07:42AM |
Registered: 8 years ago Posts: 61 |
Howo3579 - your prior post noted:
Take position:
When FullK_4H crosses above 40, buy signal is triggered only if C (total of weighted score) is greater or equal to 3.
When FullK_4H crosses below 40, short signal is triggered only if C (total of weighted score) is less or equal to -3.
Exit position:
Unload only when C is less or equal to -2.
Cover only when C is greater or equal to 2.
Your chart shows -1(100), 2(100) etc. as StochRSI value no? mine shows -100(1000) ... I see no value for the StochRSI to determine if its above/below 2 or 3 etc..
See my 4hr chart at [s14.postimg.org] and 1hr chart at [s14.postimg.org]
Also, just wondering if it would be better visually to make that Yellow line in the lower indicator turn Red when below 50% and Green when above 50%..to reflect bullish/bearish position.. just a suggestion.. Thanks again for your help..
Edited 2 time(s). Last edit at 07/04/2015 08:12AM by Tampman.
|
Re: Fun with ThinkScript July 04, 2015 08:15AM |
Registered: 8 years ago Posts: 26 |
baffled1 Wrote:
I was thinking all night and try to come up with some thing but it just made my head hurt. I was trying to use compoundvalue() and fold to do it but I have no idea how to get the barnumber of the previous 50th "eventful next" candle. I suppose Rob or some math genius can help us with that. I'm curious to know how thinkscript code can be done.
Quote
baffled1
for that next candle, i.e., an average for, say, the last 50 instances of that "next" candle, instead of an average for all the non-event intervening candles.
I was thinking all night and try to come up with some thing but it just made my head hurt. I was trying to use compoundvalue() and fold to do it but I have no idea how to get the barnumber of the previous 50th "eventful next" candle. I suppose Rob or some math genius can help us with that. I'm curious to know how thinkscript code can be done.
|
Re: Fun with ThinkScript July 04, 2015 08:37AM |
Registered: 8 years ago Posts: 26 |
Tampman,
The number -100(10000) you have on your chart is neither RSI value nor C vlaue. You can see the C value on the subgraph. If you want 4H_stochRSI on subgraph here is the code.
Now back to the -100(10000). This is result of code Addorder() in strategy. Your chart shows you are shorting 100 contracts of GC. on the other hand if it's 100(10000), it means you're buying 100 contracts. (10000) is just the actual $ you lose or gain per point. in gold future, 1 point per contract is $100, if you're taking position of 100 contract the total $ per point = $100 x 100 contracts =$10000.
If you don't quite understand right click on -100(10000) on the chart and left click on show report. It'll show you back test with details of position size and the time of trades. It shows all the trade taken using the strategy on the chart time frame. You can go back to 180 days on 1 hr chart I believe. Or you can use on demand and back test any any time frame. Then you can play around which chart period get the best result. I found 1H period is better than 4H but need to trade more often.
I have mine position size set at 1 which means for gold $ per point = $100. Go to edit study, on the left lower corner of the pop up window, select "Global strategy settings", change number of contract from 100 to 1, then your chart will be the same as mine.
The number -100(10000) you have on your chart is neither RSI value nor C vlaue. You can see the C value on the subgraph. If you want 4H_stochRSI on subgraph here is the code.
declare lower;

input RSI_length = 14;
input over_bought = 80;
input over_sold = 20;
input cross_over = 40;
input RSI_average_type = AverageType.WILDERS;
def RSI_price = close(period=AggregationPeriod.FOUR_HOURS);
input KPeriod = 14;
input DPeriod = 3;
input slowing_period = 1;
input averageType = AverageType.SIMPLE;

def RSI = RSI(price = RSI_price, length = RSI_length, averageType = RSI_average_type);

plot FullK = StochasticFull(over_bought, over_sold, KPeriod, DPeriod, RSI, RSI, RSI, slowing_period, averageType).FullK;
plot FullD = StochasticFull(over_bought, over_sold, KPeriod, DPeriod, RSI, RSI, RSI, slowing_period, averageType).FullD;
plot OverBought = over_bought;
plot OverSold = over_sold;
plot crossOver = cross_over;

FullK.SetDefaultColor(GetColor(5));
FullD.SetDefaultColor(GetColor(0));
OverBought.SetDefaultColor(GetColor(1));
OverSold.SetDefaultColor(GetColor(1));
CrossOver.SetDefaultColor(GetColor(1));
Now back to the -100(10000). This is result of code Addorder() in strategy. Your chart shows you are shorting 100 contracts of GC. on the other hand if it's 100(10000), it means you're buying 100 contracts. (10000) is just the actual $ you lose or gain per point. in gold future, 1 point per contract is $100, if you're taking position of 100 contract the total $ per point = $100 x 100 contracts =$10000.
If you don't quite understand right click on -100(10000) on the chart and left click on show report. It'll show you back test with details of position size and the time of trades. It shows all the trade taken using the strategy on the chart time frame. You can go back to 180 days on 1 hr chart I believe. Or you can use on demand and back test any any time frame. Then you can play around which chart period get the best result. I found 1H period is better than 4H but need to trade more often.
I have mine position size set at 1 which means for gold $ per point = $100. Go to edit study, on the left lower corner of the pop up window, select "Global strategy settings", change number of contract from 100 to 1, then your chart will be the same as mine.
|
Re: Fun with ThinkScript July 04, 2015 09:33AM |
Registered: 8 years ago Posts: 61 |
Howo3579 - Ah...OK. That 100 must be a default setting b/c I've never traded 100 contracts of GC..LOL I see the C value now..it's in the box at top of indicator... Thanks for clarifying and for the StochRSI 4hr code!...
Last 2 questions... Am I correct to assume since you trade off 1hr chart that you enter the trade at first signal? and What do the red and blue dotted lines signify?
Thanks again...
Edited 4 time(s). Last edit at 07/04/2015 12:55PM by Tampman.
Last 2 questions... Am I correct to assume since you trade off 1hr chart that you enter the trade at first signal? and What do the red and blue dotted lines signify?
Thanks again...
Edited 4 time(s). Last edit at 07/04/2015 12:55PM by Tampman.
|
Re: Fun with ThinkScript July 04, 2015 11:41AM |
Registered: 10 years ago Posts: 615 |
Quote
baffled1
my question is:
How do I get an average for a conditional event? Base code works fine and is:
def runup1 = close>close[1];
def runup2 = close>close[2];
#Most people write the next line as ISTRUE but this works fine for me
plot Above = runup1 and runup2;
Above.SetDefaultColor(Color.blue);
Above.SetPaintingStrategy(PaintingStrategy.BOOLEAN_ARROW_UP);
So that pops me a nice arrow when true. And it's excellent long signal. So I enter long at the next candle. But I want an average (high-close) value for that next candle, i.e., an average for, say, the last 50 instances of that "next" candle, instead of an average for all the non-event intervening candles. Your help much appreciated.
Quote
howo3579
I was thinking all night and try to come up with some thing but it just made my head hurt. I was trying to use compoundvalue() and fold to do it but I have no idea how to get the barnumber of the previous 50th "eventful next" candle. I suppose Rob or some math genius can help us with that. I'm curious to know how thinkscript code can be done.
Alright. We'll work through this one together.
Baffled, I am assuming that you want to know the average range of the first candle following a run-up signal.
Start by defining range.
def Range = High - Low;
Since we are only interested in the range of the candle directly following a run-up, we need to identify those candles.
def AfterRunup = Above[1];
Since "Above" was defined in your code as when "runup1" and "runup2" are both true, then if that occurred on the previous candle ( "Above[1]" ) then 'this' candle must be the one directly following a run-up.
Now we are ready to find the range for only those candles following a run-up.
def RangeAfterRunup = if AfterRunup then Range else 0;
To make it easier to see what's going on behind-the-scenes, I'll add the range values for the candles following a run-up to the chart.

To calculate an average, one must add all of the values for each data point then divide that by the total number of data points. The "TotalSum" function can be used to add up all the after run-up values.
def TheSum = TotalSum(RangeAfterRunup);
That will add up ALL of the after run-up range values.

Now that we have them all added up, we just need to divide that value by how many there are to get the average. But how many are there? We need a way to count them.
def counter = if AfterRunup then counter[1] + 1 else counter[1];
That line reads as: if the conditions for AfterRunup have been met, then advance the counter by one, otherwise keep the counter value the same as it was before.
Now that we've added up all of the range values and we know how many of them there are, the overall average can be calculated.
def OverallAverage = TheSum / counter;
But...you don't want to know the overall average, you want to know the average of the last 50 after run-up ranges. How can we add up only the last 50 after run-up range values? By using our counter. The counter, as we've defined it, only advances when an after run-up condition is met. So let's change our "TheSum" function as follows:
input AverageLength = 50;
def TheSum = TotalSum(if counter > HighestAll(counter) - AverageLength then RangeAfterRunup else 0);
Let's calculate a shorter average so that it's easy to verify manually that the code is working as intended.
For this example, we'll calculate the average of the last 4 after run-up ranges. In the screenshot below, the white values are the after run-up ranges and the green values are the counter.

This code is used to calculate the average.
input AverageLength = 4;
def TheSum = TotalSum(if counter > HighestAll(counter) - AverageLength then RangeAfterRunup else 0);
def AvgRange = TheSum / AverageLength;
Breaking it down so we can check it manually; TotalSum is only counting the RangeAfterRunup if the counter value is greater than the highest counter value of 190 minus our average length of 4. So, only adding the values when the counter is greater than 186.
We can manually add the values for 187, 188, 189, and 190 then divide them by 4 to verify the script result.
(1.58 + 1.39 + 1.14 + 1.09) = 5.2
(5.2) / 4 = 1.3
Whew, the script worked!
Time to put it all together.
def runup1 = close > close[1];
def runup2 = close > close[2];
plot Above = runup1 and runup2;
Above.SetDefaultColor(Color.BLUE);
Above.SetPaintingStrategy(PaintingStrategy.BOOLEAN_ARROW_UP);

# --- define range ---
def Range = high - low;
# --- define the candle immediately following a run-up ---
def AfterRunup = Above[1];
# --- define the range after a run-up ---
def RangeAfterRunup = if AfterRunup then Range else 0;
# --- count the number of AfterRunup occurrences ---
def counter = if AfterRunup then counter[1] + 1 else counter[1];
# --- add up only the last [x] number of afterRunup range values ---
input AverageLength = 50;
def TheSum = TotalSum(if counter > HighestAll(counter) - AverageLength then RangeAfterRunup else 0);
# --- calculate the average range of the past [x] number of run-ups ---
def AvgRange = TheSum / AverageLength;
# --- display the AvgRange in a chart label ---
AddLabel(yes, "The average range for the past " + AverageLength + " run-ups is: " + Round(AvgRange), Color.YELLOW);

Hope that helps.
- robert

Professional ThinkorSwim indicators for the average Joe
|
Re: Fun with ThinkScript July 04, 2015 03:27PM |
Registered: 10 years ago Posts: 615 |
Quote
Ralph53
Robert I have 3 more quick questions
1) How should this line appear if I don't want the Bubble hidden? condition.HideBubble();
Unlike some of the other functions, that one cannot be changed programmatically (i.e. it can't be turned on or off based on different conditions). Either you want to hide the bubble, so you include that statement; or you do not want to hide the bubble, in which case you would omit the statement altogether.
Quote
Ralph53
2) Is there a condition line for selecting 'Leftaxis' on a chart?
Not that I'm aware of, but you can read about activating the left axis on the thinkorswim website. [tlc.thinkorswim.com]
Quote
Ralph53
3) On this script you wrote for me;
def X = (open("period" = AggregationPeriod.DAY) - .05);
def lastbar = HighestAll(if IsNaN(close) then 0 else BarNumber());
plot condition = if BarNumber() <= lastbar - 10 and BarNumber() >= lastbar - 25 then GetValue(X, BarNumber() - lastbar) else Double.NaN;
Is there a way to place 2 different 'def' lines in the same script at once? I need the line to switch to 'def L' if the candlestick is red and 'def H' if it's green;
def L = Lowest(Low +.01, 6) 'if' close <= Open;
def H = Highest(High -.01, 6) 'if' close >= Open;
I assume this is what you meant and that you want the line offset like your last one. If not, let me know.
def CandleUp = close > open;
def X = if CandleUp then Highest(high - 0.01, 6) else Lowest(low + 0.01, 6);
def lastbar = HighestAll(if IsNaN(close) then 0 else BarNumber());
plot condition = if BarNumber() <= lastbar - 10 and BarNumber() >= lastbar - 25 then GetValue(X, BarNumber() - lastbar) else Double.NaN;
- robert
Professional ThinkorSwim indicators for the average Joe
|
Re: Fun with ThinkScript July 04, 2015 03:48PM |
Registered: 8 years ago Posts: 26 |
Robert your genius. But I'm still confused how this code gave us sum of rangeafterrunup of only the averagelength.Quote
robert
def TheSum = TotalSum(if counter > HighestAll(counter) - AverageLength then RangeAfterRunup else 0);
Let say we're at counter =90. Highestall(counter) of current bar would give us 90. Averagelength is 4. This will give us the current condition if 90>90-4, and sum all rangeafterrunup in the chart, which gives us the same value as totalsum(rangeafterrunup). Apparently your logic is correct but I fail to understand how this only gave us the sum of past 4 rangeafterrunup. The code seems to tell me if current counter > current counter-4, sum all rangeafterrunup. I feel pretty dumb right now lol.
|
Re: Fun with ThinkScript July 04, 2015 06:23PM |
Registered: 8 years ago Posts: 161 |
robert Wrote:
-------------------------------------------------------
> > my question is:
> How do I get an average for a conditional event?
> Base code works fine and is:
> Alright. We'll work through this one together.
>
> Baffled, I am assuming that you want to know the
> average range of the first candle following a
> run-up signal...
>
>... Hope that helps.
Robert!! "If I find this thread BENEFICIAL?? You kidding me? This was AWESOME. You even threw in the doodad for posting text in a chart! I only knew how to post it in a lower study. Yes, later this week I am visiting somebody's Tip Jar. Thanks thanks thanks! Was driving me crazy. And howo3579, thanks to you too for thinking about it.
|
Re: Fun with ThinkScript July 04, 2015 06:45PM |
Registered: 8 years ago Posts: 161 |
howo3579 Wrote:
-------------------------------------------------------
> I was thinking all night and try to come up with
> some thing but it just made my head hurt. I was
> trying to use compoundvalue() and fold to do it
> but I have no idea how to get the barnumber of the
> previous 50th "eventful next" candle. I suppose
> Rob or some math genius can help us with that. I'm
> curious to know how thinkscript code can be done.
howo3579, you are not alone. It kept me awake nights for a week. Usually, since I'm no expert, I weasel and worm my way into operable code. But this? I could not weasel an average from discrete event candles no matter what I tried. You should see the codes I wrote trying to get at it- they all "work" but I have no idea what they're really measuring. Thanks for thinking about it. This one should be called "Robert's Discrete Averaging Algo"
-------------------------------------------------------
> I was thinking all night and try to come up with
> some thing but it just made my head hurt. I was
> trying to use compoundvalue() and fold to do it
> but I have no idea how to get the barnumber of the
> previous 50th "eventful next" candle. I suppose
> Rob or some math genius can help us with that. I'm
> curious to know how thinkscript code can be done.
howo3579, you are not alone. It kept me awake nights for a week. Usually, since I'm no expert, I weasel and worm my way into operable code. But this? I could not weasel an average from discrete event candles no matter what I tried. You should see the codes I wrote trying to get at it- they all "work" but I have no idea what they're really measuring.
Thanks for thinking about it. This one should be called "Robert's Discrete Averaging Algo"
|
Re: Fun with ThinkScript July 05, 2015 05:45AM |
Registered: 8 years ago Posts: 61 |
|
Re: Fun with ThinkScript July 05, 2015 07:39AM |
Registered: 8 years ago Posts: 26 |
This is to see the moving average range of current candle if the previous candle broke out above its previous 2 candles. Any time frame. If you want to go long on the open of current bar when the condition is met (blue arrow), you probably need the range of close-open instead of high-low. This way you can see whether the trend is up or down. You can avoid to buy when the average range is negative.Quote
tampman
what this code is supposed to do
Edited 1 time(s). Last edit at 07/05/2015 07:49AM by howo3579.
|
Re: Fun with ThinkScript July 05, 2015 09:24AM |
Registered: 8 years ago Posts: 61 |
Howo3579 - Thanks for explaining... what do I change it to if I want to short? Also, did you see my questions from yesterday re: your Strategy set up? Thanks again for all your help.. Actually after changing code to open-close... it showed same arrows... so made no difference unless I did it wrong..?
Edited 1 time(s). Last edit at 07/05/2015 09:45AM by Tampman.
Edited 1 time(s). Last edit at 07/05/2015 09:45AM by Tampman.
|
Re: Fun with ThinkScript July 05, 2015 10:21AM |
Registered: 8 years ago Posts: 26 |
To short, you can just have another study of the same script and just change the break out condition.Quote
Tampman
what do I change it to if I want to short?
def rundown1 = close < close[1];
def rundown2 = close < close[2];
plot Below = rundown1 and rundown2;
Below.SetDefaultColor(Color.Red);
Below.SetPaintingStrategy(PaintingStrategy.BOOLEAN_ARROW_DOWN);

# --- define range ---
def Range = high - low;
# --- define the candle immediately following a run-down ---
def AfterRundown = below[1];
# --- define the range after a run-down ---
def RangeAfterRundown = if AfterRundown then Range else 0;
# --- count the number of AfterRundown occurrences ---
def counter = if AfterRundown then counter[1] + 1 else counter[1];
# --- add up only the last [x] number of afterRundown range values ---
input AverageLength = 50;
def TheSum = TotalSum(if counter > HighestAll(counter) - AverageLength then RangeAfterRundown else 0);
# --- calculate the average range of the past [x] number of run-ups ---
def AvgRange = TheSum / AverageLength;
# --- display the AvgRange in a chart label ---
AddLabel(yes, "The average range for the past " + AverageLength + " run-downs is: " + Round(AvgRange), Color.YELLOW);
If you change the range to close-open, then you want to avoid short when average range is positive.
The blue arrows have nothing to do with the range of the next bar. The arrow is painted only when condition of runup1 and runup2 are met. Then we calculate the range of the next bar after the arrow. If you change the range to close-open, the average range shown on the banner on the top left of the chart will change. Read through Robert's script and compare to the chart, you should understand what each step does to the calculation and output.Quote
Tampman
Actually after changing code to open-close... it showed same arrows... so made no difference unless I did it wrong..?
Add this code at the end of StochRSI_4H script.Quote
Tampman
Also, did you see my questions from yesterday?
just wondering if it would be better visually to make that Yellow line in the lower indicator turn Red when below 50% and Green when above 50%..to reflect bullish/bearish position
FUllK.AssignValueColor(if FUllK >= 50 then Color.Green else Color.Red);
|
Re: Fun with ThinkScript July 05, 2015 10:50AM |
Registered: 8 years ago Posts: 61 |
Howo3579 - Thanks again.. will look at it closer. I like to have labels for various indicators to save space and to provide visual confirmation of trend/price action...so if I may contribute something back to you for your help and generous sharing, here are a couple of studies that I hope you find useful.. Thanks again.
First, is a study for label for Accumulation/Distribution showing buying pressure that Rob created for me...
def data = if close > close[1] then close - Min(close[1], low) else if close < close[1] then close - Max(close[1], high) else 0;
def AccDist = TotalSum(data);
AddLabel(yes, "BuyPr: " + AccDist, if AccDist > AccDist[1] then Color.GREEN else Color.RED);
Second, is a label study that I also asked Rob to create to show the entry/exit signals for your Strategy... Long: BTO" = LIGHT_GREEN); Unload Long: STC", Color.YELLOW; "Short: BTO", Color.RED); Coverc "Short: STC", Color.PINK). However, it only shows at the first time signal is given...(so shows for first 4 bars in 1hr chart and 1 bar for 4hr):
# 4H StochRSI 40 Xover and Daily StochRSI trend
input RSI_length = 14;
input over_bought = 80;
input over_sold = 20;
input cross_over = 40;
input RSI_average_type = AverageType.WILDERS;
def RSI_price_4H = close (period = AggregationPeriod.FOUR_HOURS);
input KPeriod = 14;
input DPeriod = 3;
input slowing_period = 1;
input averageType = AverageType.SIMPLE;
def RSI_4H = RSI(price = RSI_price_4H, length = RSI_length, averageType = RSI_average_type);
def FullK_4H = StochasticFull(over_bought, over_sold, KPeriod, DPeriod, RSI_4H, RSI_4H, RSI_4H, slowing_period, averageType).FullK;
def FullK_Daily = WildersAverage((close(period = AggregationPeriod.DAY) - Lowest(low(period = AggregationPeriod.DAY), KPeriod)) / (Highest(high(period = AggregationPeriod.DAY), KPeriod) - Lowest(low(period = AggregationPeriod.DAY), KPeriod)) * 100, slowing_period);
def C1 = if FullK_4H 40 then 3 else -3;
def C4 = if (FullK_Daily = FullK_Daily[1] and FullK_Daily[1] FullK_Daily[2]) then 1 else if (FullK_Daily <= FullK_Daily[1] and FullK_Daily[1] < FullK_Daily[2]) then -1 else 0;
# 4H and Daily MACD trend
input fastLength = 12;
input slowLength = 26;
input MACDLength = 9;
input averageType2 = AverageType.EXPONENTIAL;
def Value_4H = MovingAverage(averageType2, close(period = AggregationPeriod.FOUR_HOURS), fastLength) - MovingAverage(averageType2, close(period = AggregationPeriod.FOUR_HOURS), slowLength);
def Avg_4H = MovingAverage(averageType2, Value_4H, MACDLength);
def Diff_4H = Value_4H - Avg_4H;
def Value_Daily = MovingAverage(averageType2, close(period = AggregationPeriod.DAY), fastLength) - MovingAverage(averageType2, close(period = AggregationPeriod.DAY), slowLength);
def Avg_Daily = MovingAverage(averageType2, Value_Daily, MACDLength);
def Diff_Daily = Value_Daily - Avg_Daily;
def C2 = if (Value_4H = Value_4H[1] and Value_4H[1] Value_4H[2]) then 1 else if (Value_4H <= Value_4H[1] and Value_4H[1] < Value_4H[2]) then -1 else 0;
def C5 = if (Value_Daily = Value_Daily[1] and Value_Daily[1] Value_Daily[2]) then 2 else if (Value_Daily <= Value_Daily[1] and Value_Daily[1] < Value_Daily[2]) then -2 else 0;
def C6 = if (Diff_Daily = Diff_Daily[1] and Diff_Daily[1] Diff_Daily[2]) then 2 else if (Diff_Daily <= Diff_Daily[1] and Diff_Daily[1] < Diff_Daily[2]) then -2 else 0;
def C = C1 + C2 + C4 + C5 + C6;
def triggerup = if FullK_4H 40 and FullK_4H[1] <= 40 and C = 3 then 1 else 0;
def unload = if triggerup then 0 else if C -2 then unload[1] else 1;
def unloadc = if unload and unload[1] == 0 then 1 else 0;
def triggerdown = if FullK_4H <= 40 and FullK_4H[1] 40 and C <= -3 then 1 else 0;
def cover = if triggerdown then 0 else if C < 2 then cover[1] else 1;
def coverc = if cover and cover[1] == 0 then 1 else 0;
AddLabel(triggerup, "Long: BTO", Color.LIGHT_GREEN);
AddLabel(unloadc, "Long: STC", Color.YELLOW);
AddLabel(triggerdown, "Short: BTO", Color.RED);
AddLabel(coverc, "Short: STC", Color.PINK);
|
Re: Fun with ThinkScript July 05, 2015 10:59AM |
Registered: 8 years ago Posts: 61 |
|
Re: Fun with ThinkScript July 05, 2015 11:57AM |
Registered: 8 years ago Posts: 26 |
Tampman,
I guess you can incorporate accdist to my strategy. But any time fullk macd are in uptrend, you'll have green accdist, and vise versa for downtrend. Maybe it's a little redundant to have accdist label. I think its better to actually plot accdist, then you it'll give you a big picture whether we are in acc or distribution.
The new study the plan doesn't plot stochrsi. It plots c value which is in the range of -9 to 9. I'm not following what your trying to do.
|
Re: Fun with ThinkScript July 05, 2015 12:14PM |
Registered: 8 years ago Posts: 61 |
OK...then I guess I meant the C line in your New_Study_ThePlan.. My thought was that it would show better when C value crosses into Neg/Pos territory.. but probably makes little difference as a - C value can happen just above the 0 line..
Edited 3 time(s). Last edit at 07/05/2015 01:45PM by Tampman.
Edited 3 time(s). Last edit at 07/05/2015 01:45PM by Tampman.
|
Re: Fun with ThinkScript July 05, 2015 03:55PM |
Registered: 8 years ago Posts: 26 |
You can assign condition to c line too. Ctotal.AssignValueColor(if ctotal>=2 then Color.Green else if ctotal <=-2 then Color.Red else color.gray);
This will plot c line in green if its over 2 and red below -2. I use these numbers because they are my exit condition but you can assign condition however you want.
This will plot c line in green if its over 2 and red below -2. I use these numbers because they are my exit condition but you can assign condition however you want.
|
Re: Fun with ThinkScript July 05, 2015 04:25PM |
Registered: 8 years ago Posts: 61 |
Howo3579 - That'll work... I think those values are perfect.. Gonna take a look at this during regular trading hours... looks promising.. but I am always cynical of back testing lagging indicators b/c during real time they don't work as easy as they appear to work when looking at them in retrospect. Thanks again..
Edited 1 time(s). Last edit at 07/05/2015 05:12PM by Tampman.
Edited 1 time(s). Last edit at 07/05/2015 05:12PM by Tampman.
|
Re: Fun with ThinkScript July 08, 2015 06:33AM |
Registered: 8 years ago Posts: 61 |
Howo3579 - I have been monitoring your Strategy for past few days in real time ..and the results are what I Suspected would be the case. In real time the C level can change in an instant and thus a buy or sell signal can quickly turn into a cover signal and then back again as well.... Needless to say this makes it very difficult to use as a reliable signal for entry because it does not always stay constant. For ex. Monday a buy signal was provided with. +3 signal for the Euro at 9:50 pm...on 1 hr and 4hr charts and the signal line was above the O mark and Green (I used the color variations you provided) ... At 10:30 it was still at same reading = +3. When I checked in the morning the line that had been above 0 and Green had dropped to below 0 and now read -7 and turned Red... The line from the night before that had been Green and +2 and above 0 was gone.... I watched the system during Yesterday's daytime trading hours..and saw the signal again change this time back and forth right before my eyes... Needless to say I was very disappointed because I had high hopes for this system and think it is a great idea...but due to the lack of consistency in the signal is not reliable to Use in real time.... Any thoughts or comments from others would be appreciated.... I will continue to monitor this in the hopes that perhaps the past few days were an anomaly.... But as a I had previously stated this is the problem with using lagging indicators... Always look good in retrospect but seldom useable in real time... Thanks..
|
Re: Fun with ThinkScript July 08, 2015 04:52PM |
Registered: 8 years ago Posts: 26 |
Tampman,
I haven't been able to do it in real market hours but I have been simulating using on demand the past few days. Needless to say you're absolutely right. I didn't think about it when I wrote the script. Because of 4 hour aggregation values are used on 1 hour chart, the StochRSI and C level will keep changing until 4 hour period is finished. On back test report, TOS only recorded the final data of the aggregation period. So instead of lagging indicator, during back test, value was being displayed based on future data. I apologize for not taking into account of this.
I've been doing fairly well swing trade crude and NG. Of course they've been trending the past year so it's hard not to do well. I've been trying to modify the script to long with limited order at close price - 2/3(high-low) after 4H confirmation and short at close price + 2/3(high-low). But need to cancel the order if C value is going against our condition or after a certain time. This way even tho we get in late but with good entry price like the one in backtest. However of course we'll miss out a lot of opportunities but also weed out more false entries. I don't know how well this will work but haven't figure out how to implement in thinkscript strategy.
|
Re: Fun with ThinkScript July 08, 2015 05:24PM |
Registered: 8 years ago Posts: 61 |
Howo3579 - No apologies necessary... this is a work in progress! But at least you confirm what I'm seeing..as I thought I was crazy at first..lol. Problem as you note with 4hr chart for intra-day trading is that best entry/exit opportunity is gone by the time it confirms.... I will keep playing around with this and figure something out... Will look at possibility of trying to swing trade the 4hr.... I trade futures mostly...so perhaps late night or early morning entry signals will work.. Will advise. Thanks again for all the work and help
Edited 2 time(s). Last edit at 07/08/2015 06:10PM by Tampman.
Edited 2 time(s). Last edit at 07/08/2015 06:10PM by Tampman.
|
Re: Fun with ThinkScript July 09, 2015 08:49AM |
Registered: 8 years ago Posts: 3 |
Hello All,
I wasn't sure were else to go for help but I'm trying to re-create what is going on in the image below:

First Image
The second image is related to the text below it:

Second Image
This is where I’m at now. I’m trying to place the 2nd Order Pivots on Chart. For example, it is supposed to compare 1st order pivot points at barnumber 229 (pH1[229]) to see if it is greater than equal to barnumber 224 and also barnumber 235. This check would return false. The next comparison would be pH1[224] being greater than equal to barnumber 222 and 229 to return true and add a bubble chart showing the value of the underlying.
AddChartBubble(yes, if pH1 > 0 and
pH1[n] <= pH1[n] and pH1[n] >= pH1[n]
then pH1 else Double.NaN, pH1, Color.Red,yes);
I’m not sure how to increment through the code while providing the previous and post position (bar) values to calculate the new high position (2nd order pivot). It this is possible, how do I automate it - make it work across the entire chart with out me having to input each new set of bar values?
Below is the current code:
Thanks again,
Squilly D
Edited 1 time(s). Last edit at 07/09/2015 08:53AM by squillyd.
I wasn't sure were else to go for help but I'm trying to re-create what is going on in the image below:
First Image
The second image is related to the text below it:
Second Image
This is where I’m at now. I’m trying to place the 2nd Order Pivots on Chart. For example, it is supposed to compare 1st order pivot points at barnumber 229 (pH1[229]) to see if it is greater than equal to barnumber 224 and also barnumber 235. This check would return false. The next comparison would be pH1[224] being greater than equal to barnumber 222 and 229 to return true and add a bubble chart showing the value of the underlying.
AddChartBubble(yes, if pH1 > 0 and
pH1[n] <= pH1[n] and pH1[n] >= pH1[n]
then pH1 else Double.NaN, pH1, Color.Red,yes);
I’m not sure how to increment through the code while providing the previous and post position (bar) values to calculate the new high position (2nd order pivot). It this is possible, how do I automate it - make it work across the entire chart with out me having to input each new set of bar values?
Below is the current code:
input n = 1 ;

#Charting the 1st Order Pivot Highs and Lows
def pH1 = CompoundValue(1, if high[-1] <= high and high >= high[1]
                        then high else Double.NaN, 0);
def pL1 = CompoundValue(1, if low[-1] >= low and low <= low[1]
                        then low else Double.NaN, 0);

#Creating different counts to see what the heck is going on...
rec c1 = CompoundValue(1, if !IsNaN(pH1) then c1[1] + 1 else 0, 0);
rec c2 = CompoundValue(1, if !IsNaN(pH1) then 0 else c2[1] + 1, 0); #c2 counts the number of bars between each 1st #order pivot point
rec c3 = CompoundValue(1, if !IsNaN(pH1) then c3[1] + 1 else c3[1], 0);
rec c4 = CompoundValue(1, if !IsNaN(pH1) then c4[1] else c4[1] + 1, 0);
rec c5 = CompoundValue(1, c3 + c4, 0);
rec before = CompoundValue(1, if pH1 > 0 then -c2[n]-1 else 0, 0);
rec after = CompoundValue(1, if pH1 > 0 then c2[n]+1 else 0, 0);

AddChartBubble(yes, if pH1 > 0 then pH1 else Double.NaN, barnumber(), Color.Yellow, yes); #Shows the barNumber at #pivot point
AddChartBubble(yes, if pH1 > 0 then pH1 else Double.NAN,pH1, Color.Yellow, yes); #Shows the value of underlying at #pivot point
AddChartBubble(yes, if pH1 > 0 then pH1 else Double.NAN,after, Color.Yellow, yes); #Shows the number of bars to the #left to next pivot point not counting current bar.

AddChartBubble(yes, if pH1 > 0 and
                       pH1[n] <= pH1[n] and pH1[n] >= pH1[n]
                        then pH1 else Double.NaN, pH1, Color.Red,yes);

#Plotting 1st Order highs and lows
plot pivotH_1st = if pH1 > 0 then pH1 else Double.NaN ;
plot pivotL_1st = if pL1 > 0 then pL1 else Double.Nan ;
pivotH_1st.SetStyle(Curve.POINTS);
pivotH_1st.SetDefaultColor(Color.RED);
pivotH_1st.SetLineWeight(5);
pivotL_1st.SetStyle(Curve.POINTS);
pivotL_1st.SetDefaultColor(Color.DARK_GREEN);
pivotL_1st.SetLineWeight(5);

#Maybe useful counts...
AddLabel(yes, "Total # of Bars:" + BarNumber()) ;
AddLabel(yes, "# of Bars to the Left:" + n);
AddLabel(yes, "Total # of 1st Pivots:" + c3) ;
#AddLabel(yes, "Total # of Bars Not 1st Pivots:" + c4) ;
AddLabel(yes, "# Bars to the Right:" + c5) ;
#AddLabel(yes, "Pivot Value:" + pH2[n]) ;
AddLabel(yes, "Is 1st Pivot:" + if c1[n] == 0 then "NO" else "YES" ;
AddLabel(yes, "# of Bars to Next 1st Pivot:" + c2) ;
;
AddLabel(yes, "# of Bars to Next 1st Pivot:" + c2) ;
Thanks again,
Squilly D
Edited 1 time(s). Last edit at 07/09/2015 08:53AM by squillyd.
|
Re: Fun with ThinkScript July 09, 2015 09:13AM |
Registered: 9 years ago Posts: 31 |
Hi Robert,
Can you help me to create indicator for TOS version? below is indicator for esignal system. I don't know how to convert to TOS script. Thanks in advance!
---------------------------------------------------------------------------------------------------------------------------------------------------------
Description:
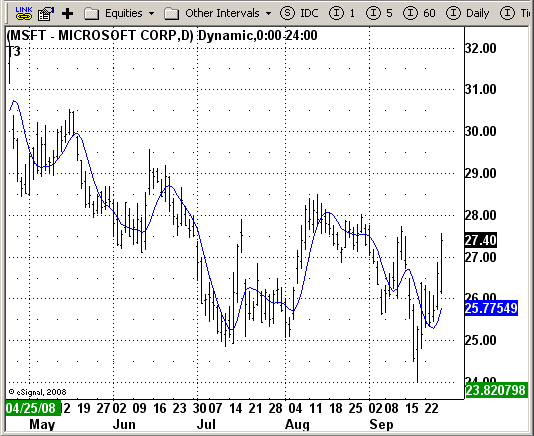
T3 Average
Formula Parameters:
Length: 5
Price Data To Use: Close
Notes:
This indicator plots the moving average described in the January, 1998 issue
of S&C, p.57, "Smoothing Techniques for More Accurate Signals", by Tim Tillson.
This indicator plots T3 moving average presented in Figure 4 in the article.
T3 indicator is a moving average which is calculated according to formula:
T3(n) = GD(GD(GD(n))),
where GD - generalized DEMA (Double EMA) and calculating according to this:
GD(n,v) = EMA(n) * (1+v)-EMA(EMA(n)) * v,
where "v" is volume factor, which determines how hot the moving averageRs response
to linear trends will be. The author advises to use v=0.7.
When v = 0, GD = EMA, and when v = 1, GD = DEMA. In between, GD is a less aggressive
version of DEMA. By using a value for v less than1, trader cure the multiple DEMA
overshoot problem but at the cost of accepting some additional phase delay.
In filter theory terminology, T3 is a six-pole nonlinear Kalman filter. Kalman
filters are ones that use the error W in this case, (time series - EMA(n)) W
to correct themselves. In the realm of technical analysis, these are called adaptive
moving averages; they track the time series more aggres-sively when it is making large
moves. Tim Tillson is a software project manager at Hewlett-Packard, with degrees in
mathematics and computer science. He has privately traded options and equities for 15 years.
Click here for chart display
EFS Code:
/*********************************
Provided By:
eSignal (Copyright c eSignal), a division of Interactive Data
Corporation. 2008. All rights reserved. This sample eSignal
Formula Script (EFS) is for educational purposes only and may be
modified and saved under a new file name. eSignal is not responsible
for the functionality once modified. eSignal reserves the right
to modify and overwrite this EFS file with each new release.
Description:
T3 Average
Version: 1.0 09/24/2008
Notes:
This indicator plots the moving average described in the January, 1998 issue
of S&C, p.57, "Smoothing Techniques for More Accurate Signals", by Tim Tillson.
This indicator plots T3 moving average presented in Figure 4 in the article.
T3 indicator is a moving average which is calculated according to formula:
T3(n) = GD(GD(GD(n))),
where GD - generalized DEMA (Double EMA) and calculating according to this:
GD(n,v) = EMA(n) * (1+v)-EMA(EMA(n)) * v,
where "v" is volume factor, which determines how hot the moving averageRs response
to linear trends will be. The author advises to use v=0.7.
When v = 0, GD = EMA, and when v = 1, GD = DEMA. In between, GD is a less aggressive
version of DEMA. By using a value for v less than1, trader cure the multiple DEMA
overshoot problem but at the cost of accepting some additional phase delay.
In filter theory terminology, T3 is a six-pole nonlinear Kalman filter. Kalman
filters are ones that use the error W in this case, (time series - EMA(n)) W
to correct themselves. In the realm of technical analysis, these are called adaptive
moving averages; they track the time series more aggres-sively when it is making large
moves. Tim Tillson is a software project manager at Hewlett-Packard, with degrees in
mathematics and computer science. He has privately traded options and equities for 15 years.
Formula Parameters: Default:
Length 5
Price Data To Use Close
**********************************/
var fpArray = new Array();
var bInit = false;
function preMain() {
setPriceStudy(true);
setStudyTitle("T3" );
setCursorLabelName("Slope", 0);
setDefaultBarFgColor(Color.blue, 0);
var x=0;
fpArray[x] = new FunctionParameter("Length", FunctionParameter.NUMBER);
with(fpArray[x++]){
setLowerLimit(1);
setDefault(5);
}
fpArray[x] = new FunctionParameter("Price", FunctionParameter.STRING);
with(fpArray[x++]){
setName("Price Data To Use" );
addOption("open" );
addOption("high" );
addOption("low" ) ;
addOption("close" );
addOption("hl2" );
addOption("hlc3" );
addOption("ohlc4" );
setDefault("close" );
}
}
var xe1 = null;
var xe2 = null;
var xe3 = null;
var xe4 = null;
var xe5 = null;
var xe6 = null;
var xMyPrice = null;
var nT3Average = 0;
function main(Price, Length) {
var nState = getBarState();
if (nState == BARSTATE_ALLBARS) {
if (Price == null) Price = "close";
if (Length == null) Length = 5;
}
if ( bInit == false ) {
xMyPrice = eval(Price)();
xe1 = ema(Length, xMyPrice);
xe2 = ema(Length, xe1);
xe3 = ema(Length, xe2);
xe4 = ema(Length, xe3);
xe5 = ema(Length, xe4);
xe6 = ema(Length, xe5);
bInit = true;
}
if (xe1.getValue(0) == null || xe2.getValue(0) == null || xe3.getValue(0) == null ||
xe4.getValue(0) == null || xe5.getValue(0) == null || xe6.getValue(0) == null) return;
var b = 0.7;
var c1 = -b*b*b;
var c2 = 3*b*b+3*b*b*b;
var c3 = -6*b*b-3*b-3*b*b*b;
var c4 = 1+3*b+b*b*b+3*b*b;
nT3Average = c1 * xe6.getValue(0) + c2 * xe5.getValue(0) + c3 * xe4.getValue(0) + c4 * xe3.getValue(0);
return nT3Average;
}
------------------------------------------------------------------------------------------------------------------------------------------------------------
Can you help me to create indicator for TOS version? below is indicator for esignal system. I don't know how to convert to TOS script. Thanks in advance!
---------------------------------------------------------------------------------------------------------------------------------------------------------
Description:
T3 Average
Formula Parameters:
Length: 5
Price Data To Use: Close
Notes:
This indicator plots the moving average described in the January, 1998 issue
of S&C, p.57, "Smoothing Techniques for More Accurate Signals", by Tim Tillson.
This indicator plots T3 moving average presented in Figure 4 in the article.
T3 indicator is a moving average which is calculated according to formula:
T3(n) = GD(GD(GD(n))),
where GD - generalized DEMA (Double EMA) and calculating according to this:
GD(n,v) = EMA(n) * (1+v)-EMA(EMA(n)) * v,
where "v" is volume factor, which determines how hot the moving averageRs response
to linear trends will be. The author advises to use v=0.7.
When v = 0, GD = EMA, and when v = 1, GD = DEMA. In between, GD is a less aggressive
version of DEMA. By using a value for v less than1, trader cure the multiple DEMA
overshoot problem but at the cost of accepting some additional phase delay.
In filter theory terminology, T3 is a six-pole nonlinear Kalman filter. Kalman
filters are ones that use the error W in this case, (time series - EMA(n)) W
to correct themselves. In the realm of technical analysis, these are called adaptive
moving averages; they track the time series more aggres-sively when it is making large
moves. Tim Tillson is a software project manager at Hewlett-Packard, with degrees in
mathematics and computer science. He has privately traded options and equities for 15 years.
Click here for chart display
EFS Code:
/*********************************
Provided By:
eSignal (Copyright c eSignal), a division of Interactive Data
Corporation. 2008. All rights reserved. This sample eSignal
Formula Script (EFS) is for educational purposes only and may be
modified and saved under a new file name. eSignal is not responsible
for the functionality once modified. eSignal reserves the right
to modify and overwrite this EFS file with each new release.
Description:
T3 Average
Version: 1.0 09/24/2008
Notes:
This indicator plots the moving average described in the January, 1998 issue
of S&C, p.57, "Smoothing Techniques for More Accurate Signals", by Tim Tillson.
This indicator plots T3 moving average presented in Figure 4 in the article.
T3 indicator is a moving average which is calculated according to formula:
T3(n) = GD(GD(GD(n))),
where GD - generalized DEMA (Double EMA) and calculating according to this:
GD(n,v) = EMA(n) * (1+v)-EMA(EMA(n)) * v,
where "v" is volume factor, which determines how hot the moving averageRs response
to linear trends will be. The author advises to use v=0.7.
When v = 0, GD = EMA, and when v = 1, GD = DEMA. In between, GD is a less aggressive
version of DEMA. By using a value for v less than1, trader cure the multiple DEMA
overshoot problem but at the cost of accepting some additional phase delay.
In filter theory terminology, T3 is a six-pole nonlinear Kalman filter. Kalman
filters are ones that use the error W in this case, (time series - EMA(n)) W
to correct themselves. In the realm of technical analysis, these are called adaptive
moving averages; they track the time series more aggres-sively when it is making large
moves. Tim Tillson is a software project manager at Hewlett-Packard, with degrees in
mathematics and computer science. He has privately traded options and equities for 15 years.
Formula Parameters: Default:
Length 5
Price Data To Use Close
**********************************/
var fpArray = new Array();
var bInit = false;
function preMain() {
setPriceStudy(true);
setStudyTitle("T3" );
setCursorLabelName("Slope", 0);
setDefaultBarFgColor(Color.blue, 0);
var x=0;
fpArray[x] = new FunctionParameter("Length", FunctionParameter.NUMBER);
with(fpArray[x++]){
setLowerLimit(1);
setDefault(5);
}
fpArray[x] = new FunctionParameter("Price", FunctionParameter.STRING);
with(fpArray[x++]){
setName("Price Data To Use" );
addOption("open" );
addOption("high" );
addOption("low" ) ;
addOption("close" );
addOption("hl2" );
addOption("hlc3" );
addOption("ohlc4" );
setDefault("close" );
}
}
var xe1 = null;
var xe2 = null;
var xe3 = null;
var xe4 = null;
var xe5 = null;
var xe6 = null;
var xMyPrice = null;
var nT3Average = 0;
function main(Price, Length) {
var nState = getBarState();
if (nState == BARSTATE_ALLBARS) {
if (Price == null) Price = "close";
if (Length == null) Length = 5;
}
if ( bInit == false ) {
xMyPrice = eval(Price)();
xe1 = ema(Length, xMyPrice);
xe2 = ema(Length, xe1);
xe3 = ema(Length, xe2);
xe4 = ema(Length, xe3);
xe5 = ema(Length, xe4);
xe6 = ema(Length, xe5);
bInit = true;
}
if (xe1.getValue(0) == null || xe2.getValue(0) == null || xe3.getValue(0) == null ||
xe4.getValue(0) == null || xe5.getValue(0) == null || xe6.getValue(0) == null) return;
var b = 0.7;
var c1 = -b*b*b;
var c2 = 3*b*b+3*b*b*b;
var c3 = -6*b*b-3*b-3*b*b*b;
var c4 = 1+3*b+b*b*b+3*b*b;
nT3Average = c1 * xe6.getValue(0) + c2 * xe5.getValue(0) + c3 * xe4.getValue(0) + c4 * xe3.getValue(0);
return nT3Average;
}
------------------------------------------------------------------------------------------------------------------------------------------------------------
|
Re: Fun with ThinkScript July 09, 2015 01:15PM |
Registered: 8 years ago Posts: 161 |


Sorry, only registered users may post in this forum.
Trade with Knowledge, Trade with Power - ResearchTrade.com.